Macedonian vs Welsh Per Capita Income
COMPARE
Macedonian
Welsh
Per Capita Income
Per Capita Income Comparison
Macedonians
Welsh
$47,573
PER CAPITA INCOME
98.8/ 100
METRIC RATING
91st/ 347
METRIC RANK
$43,233
PER CAPITA INCOME
38.2/ 100
METRIC RATING
181st/ 347
METRIC RANK
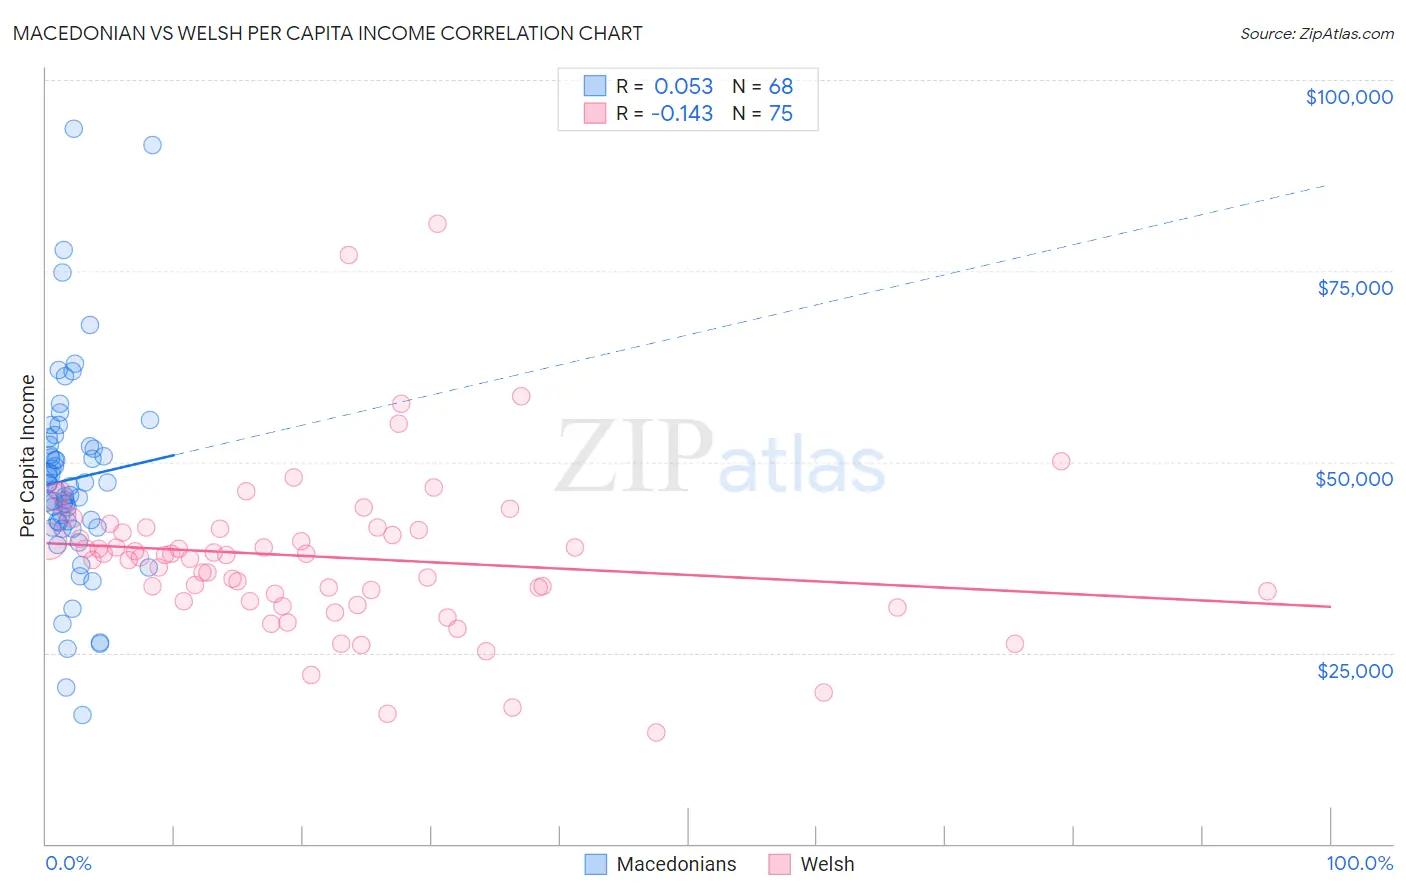
Macedonian vs Welsh Per Capita Income Correlation Chart
The statistical analysis conducted on geographies consisting of 132,587,632 people shows a slight positive correlation between the proportion of Macedonians and per capita income in the United States with a correlation coefficient (R) of 0.053 and weighted average of $47,573. Similarly, the statistical analysis conducted on geographies consisting of 528,640,565 people shows a poor negative correlation between the proportion of Welsh and per capita income in the United States with a correlation coefficient (R) of -0.143 and weighted average of $43,233, a difference of 10.0%.
Per Capita Income Correlation Summary
| Measurement | Macedonian | Welsh |
| Minimum | $16,916 | $14,496 |
| Maximum | $93,662 | $81,151 |
| Range | $76,746 | $66,655 |
| Mean | $47,728 | $37,545 |
| Median | $46,977 | $37,753 |
| Interquartile 25% (IQ1) | $41,808 | $31,788 |
| Interquartile 75% (IQ3) | $52,108 | $41,266 |
| Interquartile Range (IQR) | $10,300 | $9,478 |
| Standard Deviation (Sample) | $13,530 | $10,767 |
| Standard Deviation (Population) | $13,431 | $10,695 |
Similar Demographics by Per Capita Income
Demographics Similar to Macedonians by Per Capita Income
In terms of per capita income, the demographic groups most similar to Macedonians are Italian ($47,574, a difference of 0.0%), Immigrants from Moldova ($47,489, a difference of 0.18%), Northern European ($47,698, a difference of 0.26%), Croatian ($47,742, a difference of 0.36%), and Immigrants from Zimbabwe ($47,394, a difference of 0.38%).
| Demographics | Rating | Rank | Per Capita Income |
| Immigrants | Ukraine | 99.3 /100 | #84 | Exceptional $48,134 |
| Austrians | 99.3 /100 | #85 | Exceptional $48,116 |
| Immigrants | Southern Europe | 99.3 /100 | #86 | Exceptional $48,027 |
| Ukrainians | 99.3 /100 | #87 | Exceptional $48,014 |
| Croatians | 99.0 /100 | #88 | Exceptional $47,742 |
| Northern Europeans | 98.9 /100 | #89 | Exceptional $47,698 |
| Italians | 98.8 /100 | #90 | Exceptional $47,574 |
| Macedonians | 98.8 /100 | #91 | Exceptional $47,573 |
| Immigrants | Moldova | 98.7 /100 | #92 | Exceptional $47,489 |
| Immigrants | Zimbabwe | 98.5 /100 | #93 | Exceptional $47,394 |
| Albanians | 98.5 /100 | #94 | Exceptional $47,379 |
| Immigrants | Egypt | 98.5 /100 | #95 | Exceptional $47,361 |
| Alsatians | 98.3 /100 | #96 | Exceptional $47,284 |
| Carpatho Rusyns | 98.2 /100 | #97 | Exceptional $47,248 |
| Immigrants | Pakistan | 97.9 /100 | #98 | Exceptional $47,084 |
Demographics Similar to Welsh by Per Capita Income
In terms of per capita income, the demographic groups most similar to Welsh are Immigrants from Vietnam ($43,229, a difference of 0.010%), German ($43,067, a difference of 0.38%), Sierra Leonean ($43,405, a difference of 0.40%), Spaniard ($43,028, a difference of 0.48%), and Immigrants ($43,010, a difference of 0.52%).
| Demographics | Rating | Rank | Per Capita Income |
| Colombians | 50.0 /100 | #174 | Average $43,661 |
| Celtics | 48.9 /100 | #175 | Average $43,621 |
| Immigrants | South Eastern Asia | 46.6 /100 | #176 | Average $43,539 |
| Tlingit-Haida | 45.9 /100 | #177 | Average $43,516 |
| Immigrants | Costa Rica | 44.5 /100 | #178 | Average $43,464 |
| Finns | 44.4 /100 | #179 | Average $43,461 |
| Sierra Leoneans | 42.9 /100 | #180 | Average $43,405 |
| Welsh | 38.2 /100 | #181 | Fair $43,233 |
| Immigrants | Vietnam | 38.1 /100 | #182 | Fair $43,229 |
| Germans | 33.9 /100 | #183 | Fair $43,067 |
| Spaniards | 32.9 /100 | #184 | Fair $43,028 |
| Immigrants | Immigrants | 32.5 /100 | #185 | Fair $43,010 |
| French Canadians | 32.3 /100 | #186 | Fair $43,003 |
| Immigrants | Colombia | 31.5 /100 | #187 | Fair $42,971 |
| Immigrants | Africa | 31.0 /100 | #188 | Fair $42,950 |