Arab vs Immigrants from Australia Median Male Earnings
COMPARE
Arab
Immigrants from Australia
Median Male Earnings
Median Male Earnings Comparison
Arabs
Immigrants from Australia
$57,298
MEDIAN MALE EARNINGS
94.0/ 100
METRIC RATING
119th/ 347
METRIC RANK
$67,634
MEDIAN MALE EARNINGS
100.0/ 100
METRIC RATING
12th/ 347
METRIC RANK
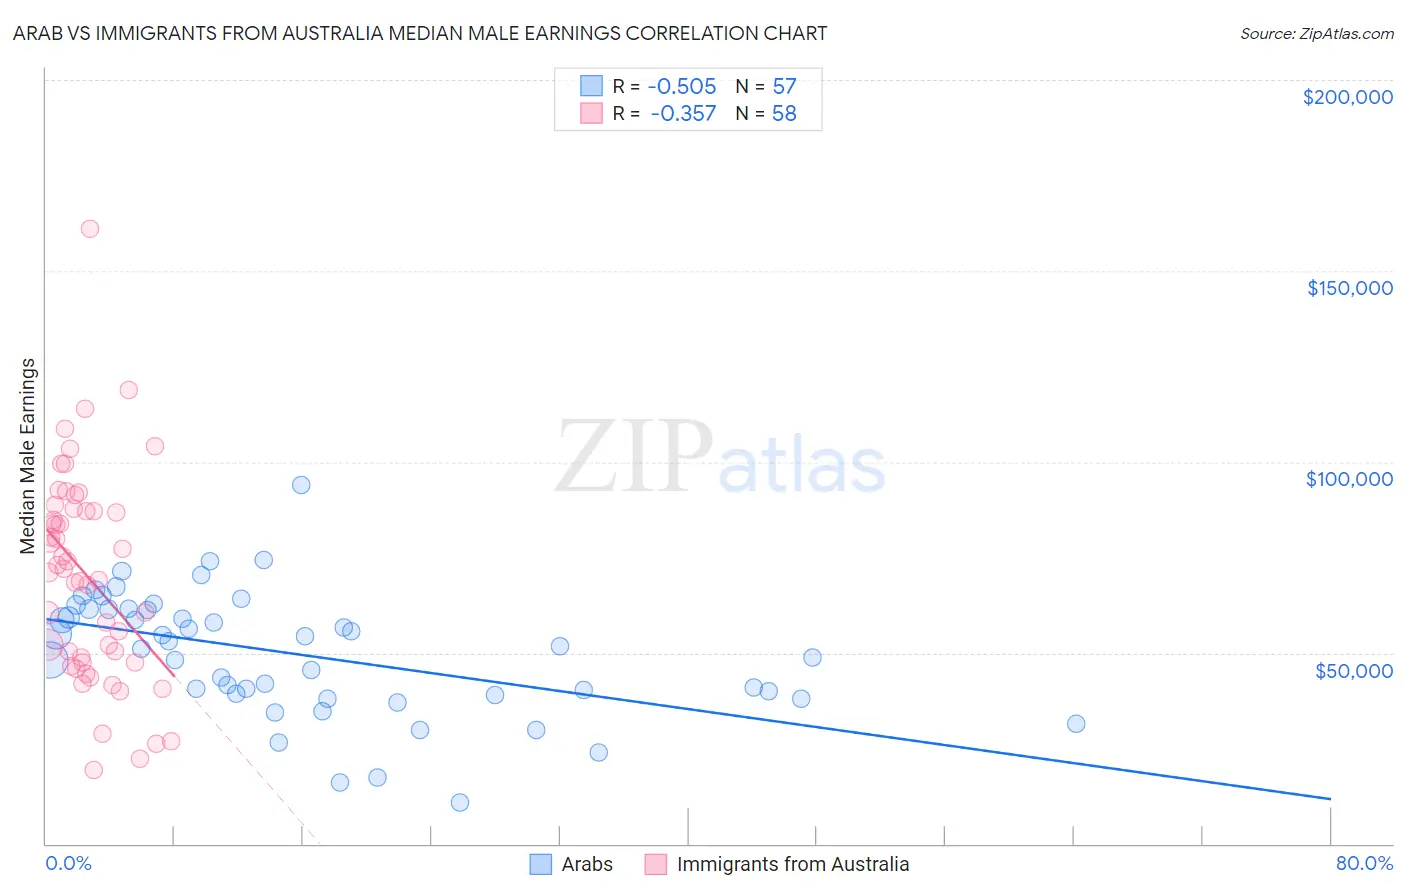
Arab vs Immigrants from Australia Median Male Earnings Correlation Chart
The statistical analysis conducted on geographies consisting of 486,638,501 people shows a substantial negative correlation between the proportion of Arabs and median male earnings in the United States with a correlation coefficient (R) of -0.505 and weighted average of $57,298. Similarly, the statistical analysis conducted on geographies consisting of 227,162,363 people shows a mild negative correlation between the proportion of Immigrants from Australia and median male earnings in the United States with a correlation coefficient (R) of -0.357 and weighted average of $67,634, a difference of 18.0%.
Median Male Earnings Correlation Summary
| Measurement | Arab | Immigrants from Australia |
| Minimum | $10,662 | $19,341 |
| Maximum | $93,845 | $160,989 |
| Range | $83,183 | $141,648 |
| Mean | $49,636 | $69,957 |
| Median | $51,622 | $71,553 |
| Interquartile 25% (IQ1) | $39,178 | $47,501 |
| Interquartile 75% (IQ3) | $61,412 | $87,155 |
| Interquartile Range (IQR) | $22,233 | $39,654 |
| Standard Deviation (Sample) | $16,136 | $27,266 |
| Standard Deviation (Population) | $15,994 | $27,029 |
Similar Demographics by Median Male Earnings
Demographics Similar to Arabs by Median Male Earnings
In terms of median male earnings, the demographic groups most similar to Arabs are Hungarian ($57,309, a difference of 0.020%), Canadian ($57,286, a difference of 0.020%), Immigrants from Zimbabwe ($57,352, a difference of 0.090%), Lebanese ($57,409, a difference of 0.19%), and Immigrants from Albania ($57,179, a difference of 0.21%).
| Demographics | Rating | Rank | Median Male Earnings |
| Immigrants | Afghanistan | 95.4 /100 | #112 | Exceptional $57,582 |
| Carpatho Rusyns | 95.3 /100 | #113 | Exceptional $57,572 |
| Immigrants | Kuwait | 95.3 /100 | #114 | Exceptional $57,562 |
| Swedes | 94.8 /100 | #115 | Exceptional $57,445 |
| Lebanese | 94.6 /100 | #116 | Exceptional $57,409 |
| Immigrants | Zimbabwe | 94.3 /100 | #117 | Exceptional $57,352 |
| Hungarians | 94.0 /100 | #118 | Exceptional $57,309 |
| Arabs | 94.0 /100 | #119 | Exceptional $57,298 |
| Canadians | 93.9 /100 | #120 | Exceptional $57,286 |
| Immigrants | Albania | 93.3 /100 | #121 | Exceptional $57,179 |
| Immigrants | Jordan | 93.1 /100 | #122 | Exceptional $57,145 |
| Slovenes | 93.1 /100 | #123 | Exceptional $57,145 |
| Chileans | 91.9 /100 | #124 | Exceptional $56,973 |
| Immigrants | Morocco | 91.8 /100 | #125 | Exceptional $56,958 |
| Chinese | 91.1 /100 | #126 | Exceptional $56,872 |
Demographics Similar to Immigrants from Australia by Median Male Earnings
In terms of median male earnings, the demographic groups most similar to Immigrants from Australia are Immigrants from Ireland ($67,698, a difference of 0.090%), Immigrants from China ($67,353, a difference of 0.42%), Okinawan ($67,232, a difference of 0.60%), Immigrants from Eastern Asia ($66,903, a difference of 1.1%), and Immigrants from Israel ($68,716, a difference of 1.6%).
| Demographics | Rating | Rank | Median Male Earnings |
| Immigrants | Singapore | 100.0 /100 | #5 | Exceptional $71,348 |
| Iranians | 100.0 /100 | #6 | Exceptional $70,648 |
| Immigrants | Hong Kong | 100.0 /100 | #7 | Exceptional $70,146 |
| Immigrants | Iran | 100.0 /100 | #8 | Exceptional $69,284 |
| Immigrants | South Central Asia | 100.0 /100 | #9 | Exceptional $68,960 |
| Immigrants | Israel | 100.0 /100 | #10 | Exceptional $68,716 |
| Immigrants | Ireland | 100.0 /100 | #11 | Exceptional $67,698 |
| Immigrants | Australia | 100.0 /100 | #12 | Exceptional $67,634 |
| Immigrants | China | 100.0 /100 | #13 | Exceptional $67,353 |
| Okinawans | 100.0 /100 | #14 | Exceptional $67,232 |
| Immigrants | Eastern Asia | 100.0 /100 | #15 | Exceptional $66,903 |
| Eastern Europeans | 100.0 /100 | #16 | Exceptional $66,472 |
| Immigrants | Belgium | 100.0 /100 | #17 | Exceptional $66,125 |
| Indians (Asian) | 100.0 /100 | #18 | Exceptional $66,078 |
| Cypriots | 100.0 /100 | #19 | Exceptional $65,549 |