Pima vs Immigrants from Australia Median Male Earnings
COMPARE
Pima
Immigrants from Australia
Median Male Earnings
Median Male Earnings Comparison
Pima
Immigrants from Australia
$42,357
MEDIAN MALE EARNINGS
0.0/ 100
METRIC RATING
339th/ 347
METRIC RANK
$67,634
MEDIAN MALE EARNINGS
100.0/ 100
METRIC RATING
12th/ 347
METRIC RANK
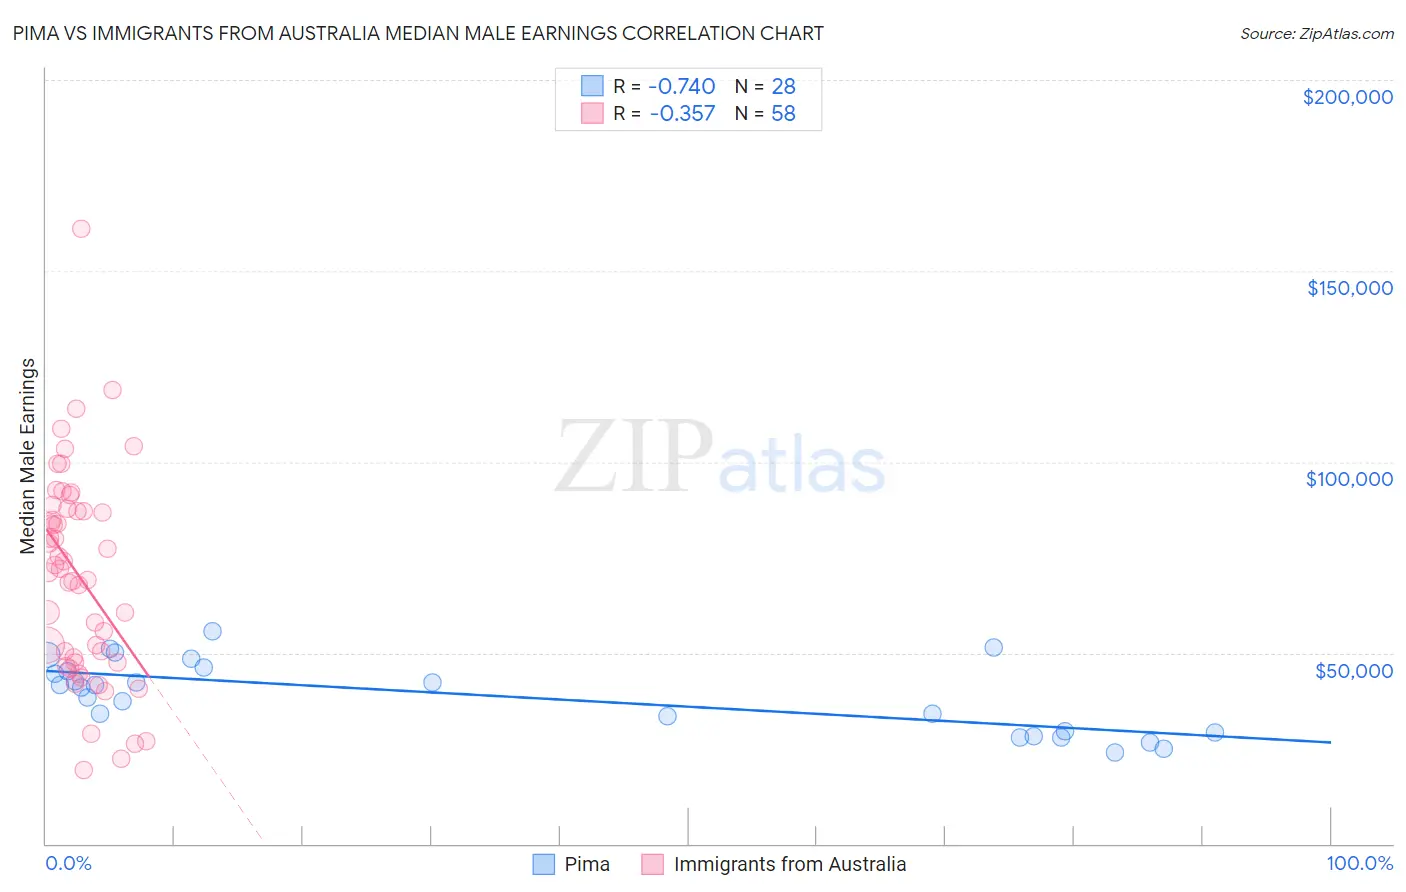
Pima vs Immigrants from Australia Median Male Earnings Correlation Chart
The statistical analysis conducted on geographies consisting of 61,536,518 people shows a strong negative correlation between the proportion of Pima and median male earnings in the United States with a correlation coefficient (R) of -0.740 and weighted average of $42,357. Similarly, the statistical analysis conducted on geographies consisting of 227,162,363 people shows a mild negative correlation between the proportion of Immigrants from Australia and median male earnings in the United States with a correlation coefficient (R) of -0.357 and weighted average of $67,634, a difference of 59.7%.
Median Male Earnings Correlation Summary
| Measurement | Pima | Immigrants from Australia |
| Minimum | $23,884 | $19,341 |
| Maximum | $55,769 | $160,989 |
| Range | $31,885 | $141,648 |
| Mean | $38,846 | $69,957 |
| Median | $41,189 | $71,553 |
| Interquartile 25% (IQ1) | $29,407 | $47,501 |
| Interquartile 75% (IQ3) | $45,710 | $87,155 |
| Interquartile Range (IQR) | $16,303 | $39,654 |
| Standard Deviation (Sample) | $9,196 | $27,266 |
| Standard Deviation (Population) | $9,031 | $27,029 |
Similar Demographics by Median Male Earnings
Demographics Similar to Pima by Median Male Earnings
In terms of median male earnings, the demographic groups most similar to Pima are Crow ($42,434, a difference of 0.18%), Menominee ($42,581, a difference of 0.53%), Navajo ($42,098, a difference of 0.62%), Hopi ($42,060, a difference of 0.71%), and Arapaho ($41,758, a difference of 1.4%).
| Demographics | Rating | Rank | Median Male Earnings |
| Bahamians | 0.0 /100 | #332 | Tragic $44,756 |
| Immigrants | Congo | 0.0 /100 | #333 | Tragic $44,204 |
| Immigrants | Yemen | 0.0 /100 | #334 | Tragic $44,083 |
| Spanish American Indians | 0.0 /100 | #335 | Tragic $44,010 |
| Immigrants | Cuba | 0.0 /100 | #336 | Tragic $43,461 |
| Menominee | 0.0 /100 | #337 | Tragic $42,581 |
| Crow | 0.0 /100 | #338 | Tragic $42,434 |
| Pima | 0.0 /100 | #339 | Tragic $42,357 |
| Navajo | 0.0 /100 | #340 | Tragic $42,098 |
| Hopi | 0.0 /100 | #341 | Tragic $42,060 |
| Arapaho | 0.0 /100 | #342 | Tragic $41,758 |
| Lumbee | 0.0 /100 | #343 | Tragic $41,715 |
| Pueblo | 0.0 /100 | #344 | Tragic $41,314 |
| Puerto Ricans | 0.0 /100 | #345 | Tragic $40,071 |
| Tohono O'odham | 0.0 /100 | #346 | Tragic $39,543 |
Demographics Similar to Immigrants from Australia by Median Male Earnings
In terms of median male earnings, the demographic groups most similar to Immigrants from Australia are Immigrants from Ireland ($67,698, a difference of 0.090%), Immigrants from China ($67,353, a difference of 0.42%), Okinawan ($67,232, a difference of 0.60%), Immigrants from Eastern Asia ($66,903, a difference of 1.1%), and Immigrants from Israel ($68,716, a difference of 1.6%).
| Demographics | Rating | Rank | Median Male Earnings |
| Immigrants | Singapore | 100.0 /100 | #5 | Exceptional $71,348 |
| Iranians | 100.0 /100 | #6 | Exceptional $70,648 |
| Immigrants | Hong Kong | 100.0 /100 | #7 | Exceptional $70,146 |
| Immigrants | Iran | 100.0 /100 | #8 | Exceptional $69,284 |
| Immigrants | South Central Asia | 100.0 /100 | #9 | Exceptional $68,960 |
| Immigrants | Israel | 100.0 /100 | #10 | Exceptional $68,716 |
| Immigrants | Ireland | 100.0 /100 | #11 | Exceptional $67,698 |
| Immigrants | Australia | 100.0 /100 | #12 | Exceptional $67,634 |
| Immigrants | China | 100.0 /100 | #13 | Exceptional $67,353 |
| Okinawans | 100.0 /100 | #14 | Exceptional $67,232 |
| Immigrants | Eastern Asia | 100.0 /100 | #15 | Exceptional $66,903 |
| Eastern Europeans | 100.0 /100 | #16 | Exceptional $66,472 |
| Immigrants | Belgium | 100.0 /100 | #17 | Exceptional $66,125 |
| Indians (Asian) | 100.0 /100 | #18 | Exceptional $66,078 |
| Cypriots | 100.0 /100 | #19 | Exceptional $65,549 |