Arab vs Immigrants from Sierra Leone Median Male Earnings
COMPARE
Arab
Immigrants from Sierra Leone
Median Male Earnings
Median Male Earnings Comparison
Arabs
Immigrants from Sierra Leone
$57,298
MEDIAN MALE EARNINGS
94.0/ 100
METRIC RATING
119th/ 347
METRIC RANK
$53,905
MEDIAN MALE EARNINGS
36.0/ 100
METRIC RATING
185th/ 347
METRIC RANK
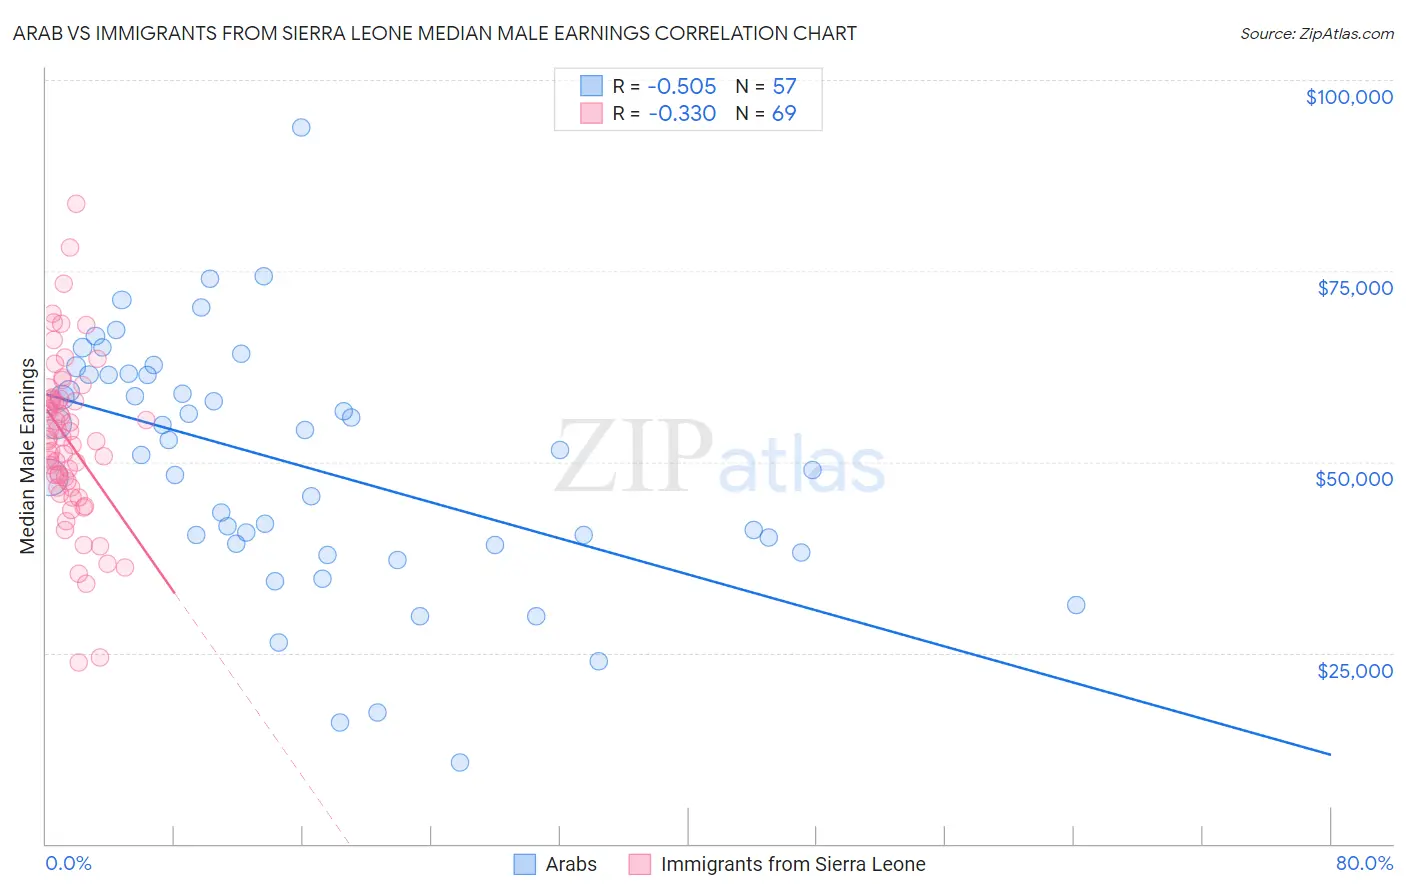
Arab vs Immigrants from Sierra Leone Median Male Earnings Correlation Chart
The statistical analysis conducted on geographies consisting of 486,638,501 people shows a substantial negative correlation between the proportion of Arabs and median male earnings in the United States with a correlation coefficient (R) of -0.505 and weighted average of $57,298. Similarly, the statistical analysis conducted on geographies consisting of 101,648,360 people shows a mild negative correlation between the proportion of Immigrants from Sierra Leone and median male earnings in the United States with a correlation coefficient (R) of -0.330 and weighted average of $53,905, a difference of 6.3%.
Median Male Earnings Correlation Summary
| Measurement | Arab | Immigrants from Sierra Leone |
| Minimum | $10,662 | $23,693 |
| Maximum | $93,845 | $83,830 |
| Range | $83,183 | $60,137 |
| Mean | $49,636 | $52,734 |
| Median | $51,622 | $52,856 |
| Interquartile 25% (IQ1) | $39,178 | $46,657 |
| Interquartile 75% (IQ3) | $61,412 | $58,267 |
| Interquartile Range (IQR) | $22,233 | $11,610 |
| Standard Deviation (Sample) | $16,136 | $10,929 |
| Standard Deviation (Population) | $15,994 | $10,849 |
Similar Demographics by Median Male Earnings
Demographics Similar to Arabs by Median Male Earnings
In terms of median male earnings, the demographic groups most similar to Arabs are Hungarian ($57,309, a difference of 0.020%), Canadian ($57,286, a difference of 0.020%), Immigrants from Zimbabwe ($57,352, a difference of 0.090%), Lebanese ($57,409, a difference of 0.19%), and Immigrants from Albania ($57,179, a difference of 0.21%).
| Demographics | Rating | Rank | Median Male Earnings |
| Immigrants | Afghanistan | 95.4 /100 | #112 | Exceptional $57,582 |
| Carpatho Rusyns | 95.3 /100 | #113 | Exceptional $57,572 |
| Immigrants | Kuwait | 95.3 /100 | #114 | Exceptional $57,562 |
| Swedes | 94.8 /100 | #115 | Exceptional $57,445 |
| Lebanese | 94.6 /100 | #116 | Exceptional $57,409 |
| Immigrants | Zimbabwe | 94.3 /100 | #117 | Exceptional $57,352 |
| Hungarians | 94.0 /100 | #118 | Exceptional $57,309 |
| Arabs | 94.0 /100 | #119 | Exceptional $57,298 |
| Canadians | 93.9 /100 | #120 | Exceptional $57,286 |
| Immigrants | Albania | 93.3 /100 | #121 | Exceptional $57,179 |
| Immigrants | Jordan | 93.1 /100 | #122 | Exceptional $57,145 |
| Slovenes | 93.1 /100 | #123 | Exceptional $57,145 |
| Chileans | 91.9 /100 | #124 | Exceptional $56,973 |
| Immigrants | Morocco | 91.8 /100 | #125 | Exceptional $56,958 |
| Chinese | 91.1 /100 | #126 | Exceptional $56,872 |
Demographics Similar to Immigrants from Sierra Leone by Median Male Earnings
In terms of median male earnings, the demographic groups most similar to Immigrants from Sierra Leone are White/Caucasian ($53,925, a difference of 0.040%), Yugoslavian ($53,967, a difference of 0.11%), Immigrants from South America ($53,962, a difference of 0.11%), Colombian ($53,832, a difference of 0.14%), and Immigrants from Eritrea ($53,715, a difference of 0.35%).
| Demographics | Rating | Rank | Median Male Earnings |
| Sierra Leoneans | 44.8 /100 | #178 | Average $54,279 |
| Celtics | 43.9 /100 | #179 | Average $54,242 |
| Iraqis | 42.5 /100 | #180 | Average $54,182 |
| Immigrants | Immigrants | 42.1 /100 | #181 | Average $54,168 |
| Yugoslavians | 37.4 /100 | #182 | Fair $53,967 |
| Immigrants | South America | 37.3 /100 | #183 | Fair $53,962 |
| Whites/Caucasians | 36.5 /100 | #184 | Fair $53,925 |
| Immigrants | Sierra Leone | 36.0 /100 | #185 | Fair $53,905 |
| Colombians | 34.4 /100 | #186 | Fair $53,832 |
| Immigrants | Eritrea | 31.8 /100 | #187 | Fair $53,715 |
| Immigrants | Eastern Africa | 31.8 /100 | #188 | Fair $53,713 |
| Puget Sound Salish | 31.6 /100 | #189 | Fair $53,704 |
| Uruguayans | 31.1 /100 | #190 | Fair $53,680 |
| Guamanians/Chamorros | 30.7 /100 | #191 | Fair $53,661 |
| Scotch-Irish | 30.6 /100 | #192 | Fair $53,658 |