Arab vs Irish Median Male Earnings
COMPARE
Arab
Irish
Median Male Earnings
Median Male Earnings Comparison
Arabs
Irish
$57,298
MEDIAN MALE EARNINGS
94.0/ 100
METRIC RATING
119th/ 347
METRIC RANK
$56,464
MEDIAN MALE EARNINGS
87.4/ 100
METRIC RATING
135th/ 347
METRIC RANK
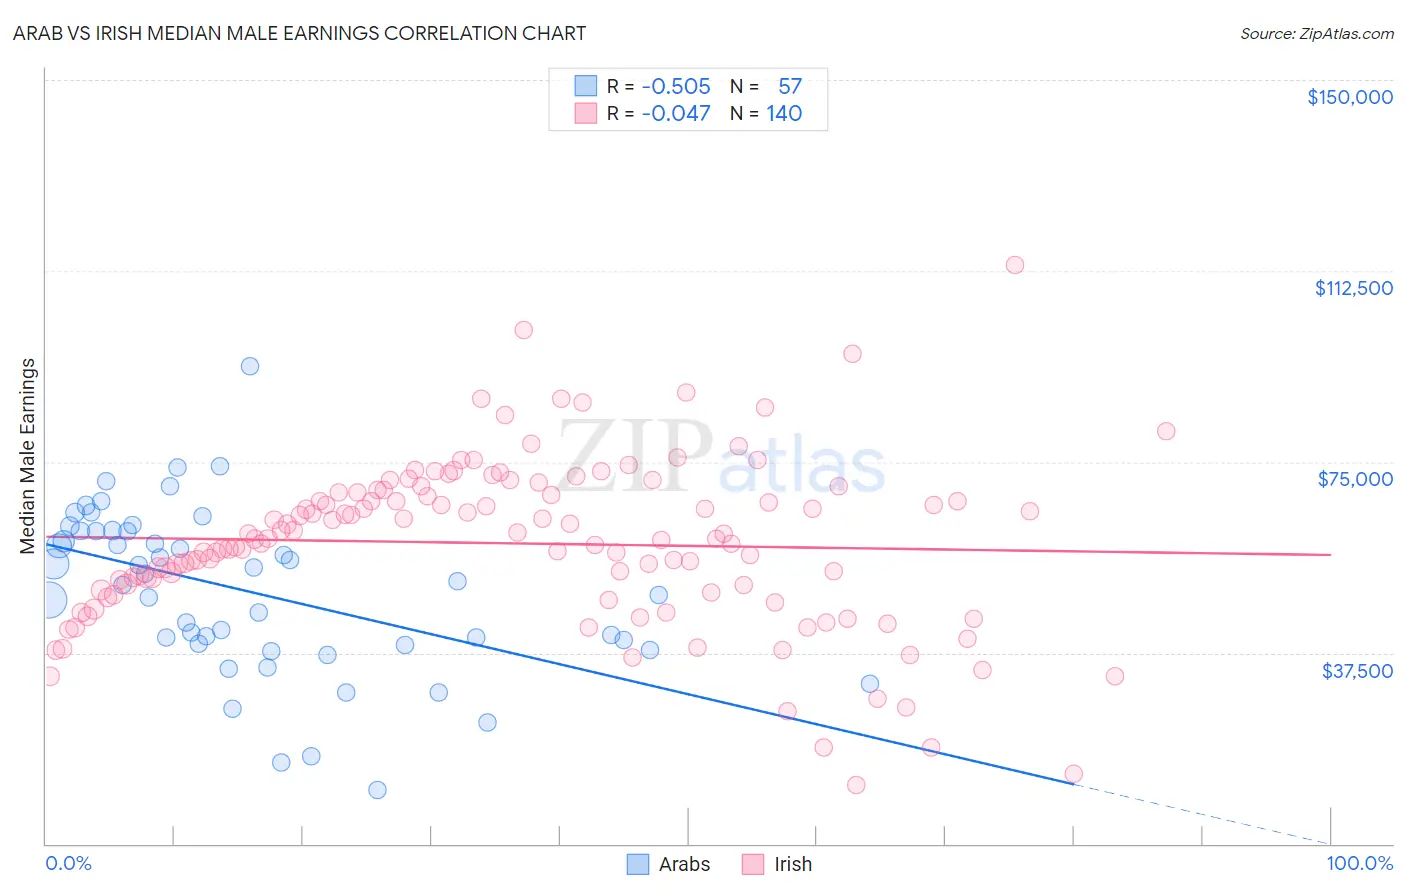
Arab vs Irish Median Male Earnings Correlation Chart
The statistical analysis conducted on geographies consisting of 486,638,501 people shows a substantial negative correlation between the proportion of Arabs and median male earnings in the United States with a correlation coefficient (R) of -0.505 and weighted average of $57,298. Similarly, the statistical analysis conducted on geographies consisting of 578,544,263 people shows no correlation between the proportion of Irish and median male earnings in the United States with a correlation coefficient (R) of -0.047 and weighted average of $56,464, a difference of 1.5%.
Median Male Earnings Correlation Summary
| Measurement | Arab | Irish |
| Minimum | $10,662 | $11,458 |
| Maximum | $93,845 | $113,788 |
| Range | $83,183 | $102,330 |
| Mean | $49,636 | $59,014 |
| Median | $51,622 | $59,889 |
| Interquartile 25% (IQ1) | $39,178 | $49,565 |
| Interquartile 75% (IQ3) | $61,412 | $68,949 |
| Interquartile Range (IQR) | $22,233 | $19,384 |
| Standard Deviation (Sample) | $16,136 | $16,409 |
| Standard Deviation (Population) | $15,994 | $16,350 |
Demographics Similar to Arabs and Irish by Median Male Earnings
In terms of median male earnings, the demographic groups most similar to Arabs are Hungarian ($57,309, a difference of 0.020%), Canadian ($57,286, a difference of 0.020%), Immigrants from Zimbabwe ($57,352, a difference of 0.090%), Immigrants from Albania ($57,179, a difference of 0.21%), and Immigrants from Jordan ($57,145, a difference of 0.27%). Similarly, the demographic groups most similar to Irish are Immigrants from Saudi Arabia ($56,452, a difference of 0.020%), Moroccan ($56,499, a difference of 0.060%), Slavic ($56,390, a difference of 0.13%), Czech ($56,546, a difference of 0.14%), and Immigrants from Germany ($56,542, a difference of 0.14%).
| Demographics | Rating | Rank | Median Male Earnings |
| Immigrants | Zimbabwe | 94.3 /100 | #117 | Exceptional $57,352 |
| Hungarians | 94.0 /100 | #118 | Exceptional $57,309 |
| Arabs | 94.0 /100 | #119 | Exceptional $57,298 |
| Canadians | 93.9 /100 | #120 | Exceptional $57,286 |
| Immigrants | Albania | 93.3 /100 | #121 | Exceptional $57,179 |
| Immigrants | Jordan | 93.1 /100 | #122 | Exceptional $57,145 |
| Slovenes | 93.1 /100 | #123 | Exceptional $57,145 |
| Chileans | 91.9 /100 | #124 | Exceptional $56,973 |
| Immigrants | Morocco | 91.8 /100 | #125 | Exceptional $56,958 |
| Chinese | 91.1 /100 | #126 | Exceptional $56,872 |
| Brazilians | 90.9 /100 | #127 | Exceptional $56,837 |
| Immigrants | Syria | 90.8 /100 | #128 | Exceptional $56,830 |
| Pakistanis | 89.9 /100 | #129 | Excellent $56,719 |
| Koreans | 89.4 /100 | #130 | Excellent $56,672 |
| Portuguese | 89.4 /100 | #131 | Excellent $56,663 |
| Czechs | 88.2 /100 | #132 | Excellent $56,546 |
| Immigrants | Germany | 88.2 /100 | #133 | Excellent $56,542 |
| Moroccans | 87.7 /100 | #134 | Excellent $56,499 |
| Irish | 87.4 /100 | #135 | Excellent $56,464 |
| Immigrants | Saudi Arabia | 87.2 /100 | #136 | Excellent $56,452 |
| Slavs | 86.5 /100 | #137 | Excellent $56,390 |