Arab vs Hungarian Median Male Earnings
COMPARE
Arab
Hungarian
Median Male Earnings
Median Male Earnings Comparison
Arabs
Hungarians
$57,298
MEDIAN MALE EARNINGS
94.0/ 100
METRIC RATING
119th/ 347
METRIC RANK
$57,309
MEDIAN MALE EARNINGS
94.0/ 100
METRIC RATING
118th/ 347
METRIC RANK
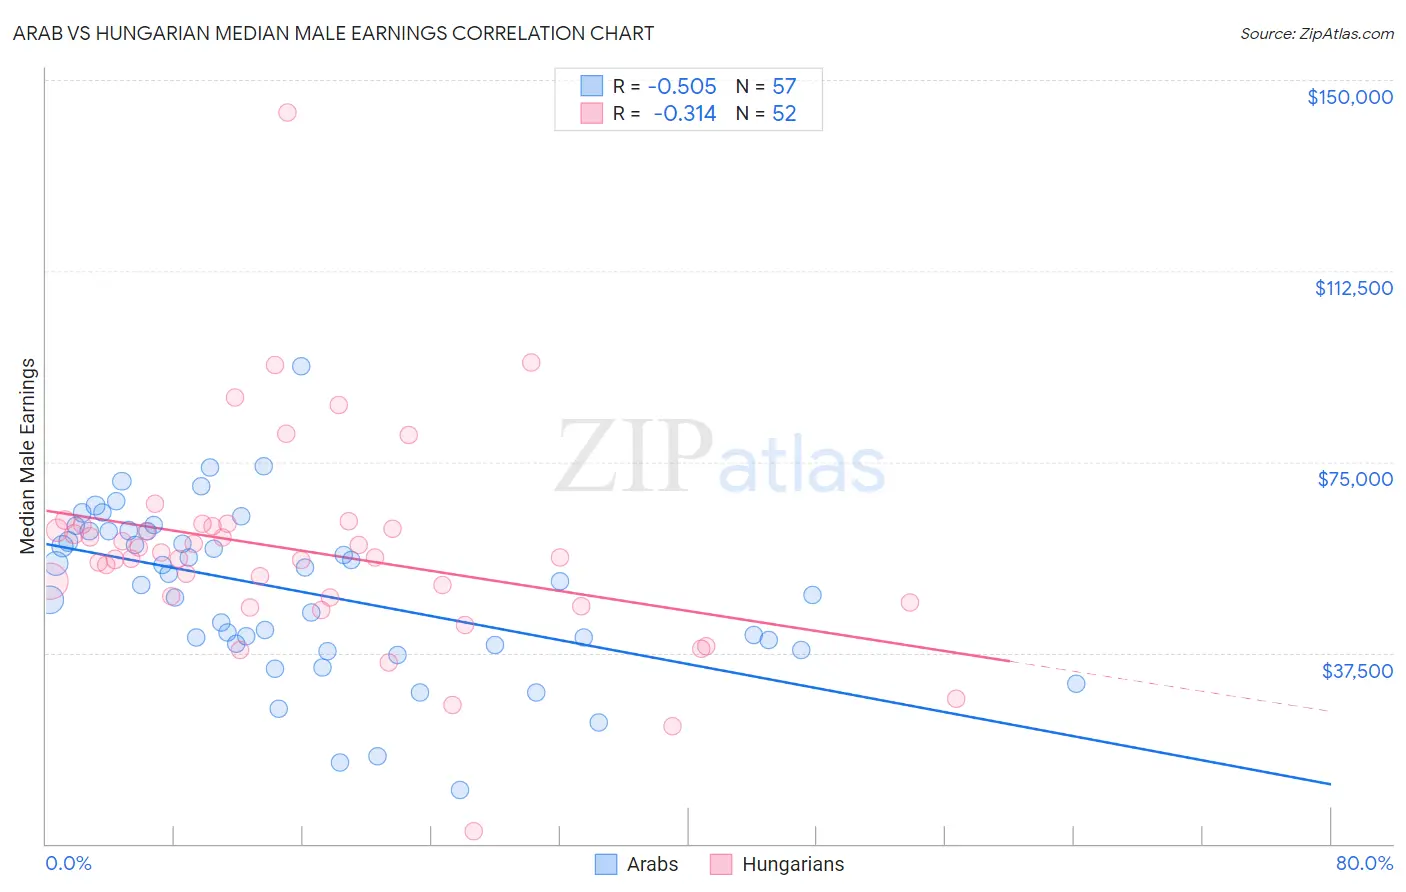
Arab vs Hungarian Median Male Earnings Correlation Chart
The statistical analysis conducted on geographies consisting of 486,638,501 people shows a substantial negative correlation between the proportion of Arabs and median male earnings in the United States with a correlation coefficient (R) of -0.505 and weighted average of $57,298. Similarly, the statistical analysis conducted on geographies consisting of 485,879,965 people shows a mild negative correlation between the proportion of Hungarians and median male earnings in the United States with a correlation coefficient (R) of -0.314 and weighted average of $57,309, a difference of 0.020%.
Median Male Earnings Correlation Summary
| Measurement | Arab | Hungarian |
| Minimum | $10,662 | $2,499 |
| Maximum | $93,845 | $143,630 |
| Range | $83,183 | $141,131 |
| Mean | $49,636 | $57,349 |
| Median | $51,622 | $56,238 |
| Interquartile 25% (IQ1) | $39,178 | $47,969 |
| Interquartile 75% (IQ3) | $61,412 | $62,536 |
| Interquartile Range (IQR) | $22,233 | $14,567 |
| Standard Deviation (Sample) | $16,136 | $20,677 |
| Standard Deviation (Population) | $15,994 | $20,477 |
Demographics Similar to Arabs and Hungarians by Median Male Earnings
In terms of median male earnings, the demographic groups most similar to Arabs are Canadian ($57,286, a difference of 0.020%), Immigrants from Zimbabwe ($57,352, a difference of 0.090%), Lebanese ($57,409, a difference of 0.19%), Immigrants from Albania ($57,179, a difference of 0.21%), and Swedish ($57,445, a difference of 0.26%). Similarly, the demographic groups most similar to Hungarians are Canadian ($57,286, a difference of 0.040%), Immigrants from Zimbabwe ($57,352, a difference of 0.080%), Lebanese ($57,409, a difference of 0.18%), Immigrants from Albania ($57,179, a difference of 0.23%), and Swedish ($57,445, a difference of 0.24%).
| Demographics | Rating | Rank | Median Male Earnings |
| Immigrants | Uzbekistan | 96.7 /100 | #108 | Exceptional $57,941 |
| British | 96.5 /100 | #109 | Exceptional $57,890 |
| Palestinians | 96.2 /100 | #110 | Exceptional $57,778 |
| Europeans | 95.6 /100 | #111 | Exceptional $57,637 |
| Immigrants | Afghanistan | 95.4 /100 | #112 | Exceptional $57,582 |
| Carpatho Rusyns | 95.3 /100 | #113 | Exceptional $57,572 |
| Immigrants | Kuwait | 95.3 /100 | #114 | Exceptional $57,562 |
| Swedes | 94.8 /100 | #115 | Exceptional $57,445 |
| Lebanese | 94.6 /100 | #116 | Exceptional $57,409 |
| Immigrants | Zimbabwe | 94.3 /100 | #117 | Exceptional $57,352 |
| Hungarians | 94.0 /100 | #118 | Exceptional $57,309 |
| Arabs | 94.0 /100 | #119 | Exceptional $57,298 |
| Canadians | 93.9 /100 | #120 | Exceptional $57,286 |
| Immigrants | Albania | 93.3 /100 | #121 | Exceptional $57,179 |
| Immigrants | Jordan | 93.1 /100 | #122 | Exceptional $57,145 |
| Slovenes | 93.1 /100 | #123 | Exceptional $57,145 |
| Chileans | 91.9 /100 | #124 | Exceptional $56,973 |
| Immigrants | Morocco | 91.8 /100 | #125 | Exceptional $56,958 |
| Chinese | 91.1 /100 | #126 | Exceptional $56,872 |
| Brazilians | 90.9 /100 | #127 | Exceptional $56,837 |
| Immigrants | Syria | 90.8 /100 | #128 | Exceptional $56,830 |