Afghan vs Cheyenne Median Male Earnings
COMPARE
Afghan
Cheyenne
Median Male Earnings
Median Male Earnings Comparison
Afghans
Cheyenne
$59,554
MEDIAN MALE EARNINGS
99.3/ 100
METRIC RATING
84th/ 347
METRIC RANK
$46,062
MEDIAN MALE EARNINGS
0.0/ 100
METRIC RATING
318th/ 347
METRIC RANK
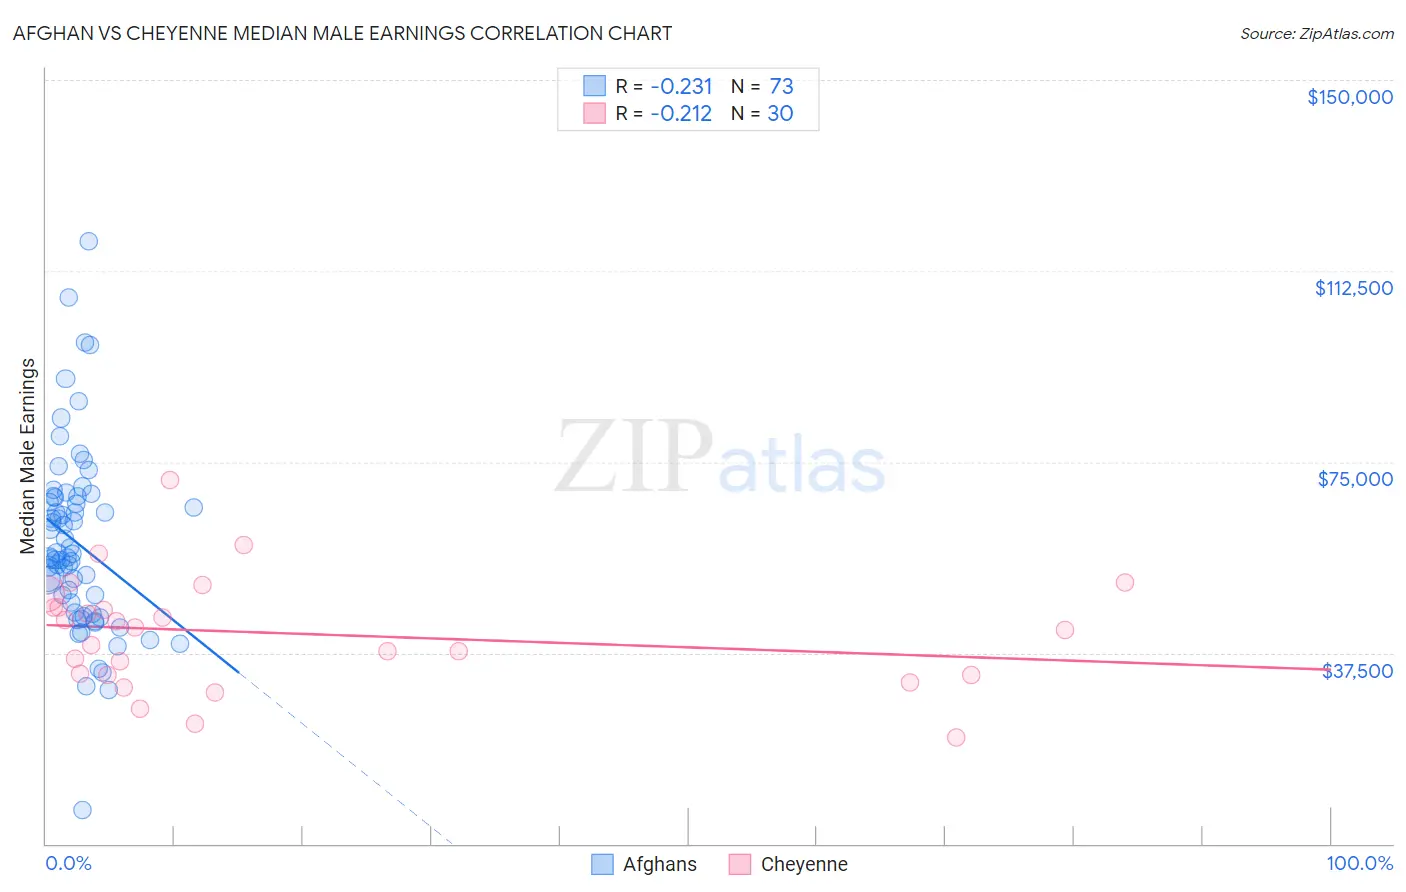
Afghan vs Cheyenne Median Male Earnings Correlation Chart
The statistical analysis conducted on geographies consisting of 148,869,100 people shows a weak negative correlation between the proportion of Afghans and median male earnings in the United States with a correlation coefficient (R) of -0.231 and weighted average of $59,554. Similarly, the statistical analysis conducted on geographies consisting of 80,706,071 people shows a weak negative correlation between the proportion of Cheyenne and median male earnings in the United States with a correlation coefficient (R) of -0.212 and weighted average of $46,062, a difference of 29.3%.
Median Male Earnings Correlation Summary
| Measurement | Afghan | Cheyenne |
| Minimum | $6,707 | $20,903 |
| Maximum | $118,365 | $71,550 |
| Range | $111,658 | $50,647 |
| Mean | $59,002 | $41,316 |
| Median | $56,261 | $42,260 |
| Interquartile 25% (IQ1) | $45,293 | $33,100 |
| Interquartile 75% (IQ3) | $68,035 | $46,481 |
| Interquartile Range (IQR) | $22,742 | $13,381 |
| Standard Deviation (Sample) | $18,269 | $10,984 |
| Standard Deviation (Population) | $18,144 | $10,799 |
Similar Demographics by Median Male Earnings
Demographics Similar to Afghans by Median Male Earnings
In terms of median male earnings, the demographic groups most similar to Afghans are Italian ($59,551, a difference of 0.0%), Immigrants from England ($59,527, a difference of 0.050%), Macedonian ($59,522, a difference of 0.050%), Immigrants from Argentina ($59,491, a difference of 0.11%), and Immigrants from Italy ($59,691, a difference of 0.23%).
| Demographics | Rating | Rank | Median Male Earnings |
| Paraguayans | 99.5 /100 | #77 | Exceptional $59,975 |
| Immigrants | Egypt | 99.5 /100 | #78 | Exceptional $59,925 |
| Immigrants | Ukraine | 99.5 /100 | #79 | Exceptional $59,820 |
| Immigrants | Hungary | 99.5 /100 | #80 | Exceptional $59,806 |
| Ukrainians | 99.4 /100 | #81 | Exceptional $59,728 |
| Croatians | 99.4 /100 | #82 | Exceptional $59,715 |
| Immigrants | Italy | 99.4 /100 | #83 | Exceptional $59,691 |
| Afghans | 99.3 /100 | #84 | Exceptional $59,554 |
| Italians | 99.3 /100 | #85 | Exceptional $59,551 |
| Immigrants | England | 99.3 /100 | #86 | Exceptional $59,527 |
| Macedonians | 99.3 /100 | #87 | Exceptional $59,522 |
| Immigrants | Argentina | 99.3 /100 | #88 | Exceptional $59,491 |
| Immigrants | Moldova | 99.2 /100 | #89 | Exceptional $59,417 |
| Austrians | 99.2 /100 | #90 | Exceptional $59,359 |
| Laotians | 99.2 /100 | #91 | Exceptional $59,351 |
Demographics Similar to Cheyenne by Median Male Earnings
In terms of median male earnings, the demographic groups most similar to Cheyenne are Mexican ($46,147, a difference of 0.18%), Immigrants from Caribbean ($46,193, a difference of 0.28%), Haitian ($45,903, a difference of 0.35%), Immigrants from Guatemala ($46,244, a difference of 0.39%), and Immigrants from Honduras ($45,787, a difference of 0.60%).
| Demographics | Rating | Rank | Median Male Earnings |
| Apache | 0.0 /100 | #311 | Tragic $46,429 |
| Hispanics or Latinos | 0.0 /100 | #312 | Tragic $46,419 |
| Hondurans | 0.0 /100 | #313 | Tragic $46,374 |
| Chippewa | 0.0 /100 | #314 | Tragic $46,368 |
| Immigrants | Guatemala | 0.0 /100 | #315 | Tragic $46,244 |
| Immigrants | Caribbean | 0.0 /100 | #316 | Tragic $46,193 |
| Mexicans | 0.0 /100 | #317 | Tragic $46,147 |
| Cheyenne | 0.0 /100 | #318 | Tragic $46,062 |
| Haitians | 0.0 /100 | #319 | Tragic $45,903 |
| Immigrants | Honduras | 0.0 /100 | #320 | Tragic $45,787 |
| Fijians | 0.0 /100 | #321 | Tragic $45,607 |
| Sioux | 0.0 /100 | #322 | Tragic $45,566 |
| Immigrants | Central America | 0.0 /100 | #323 | Tragic $45,538 |
| Blacks/African Americans | 0.0 /100 | #324 | Tragic $45,523 |
| Yuman | 0.0 /100 | #325 | Tragic $45,446 |