Afghan vs Australian Median Male Earnings
COMPARE
Afghan
Australian
Median Male Earnings
Median Male Earnings Comparison
Afghans
Australians
$59,554
MEDIAN MALE EARNINGS
99.3/ 100
METRIC RATING
84th/ 347
METRIC RANK
$62,857
MEDIAN MALE EARNINGS
100.0/ 100
METRIC RATING
40th/ 347
METRIC RANK
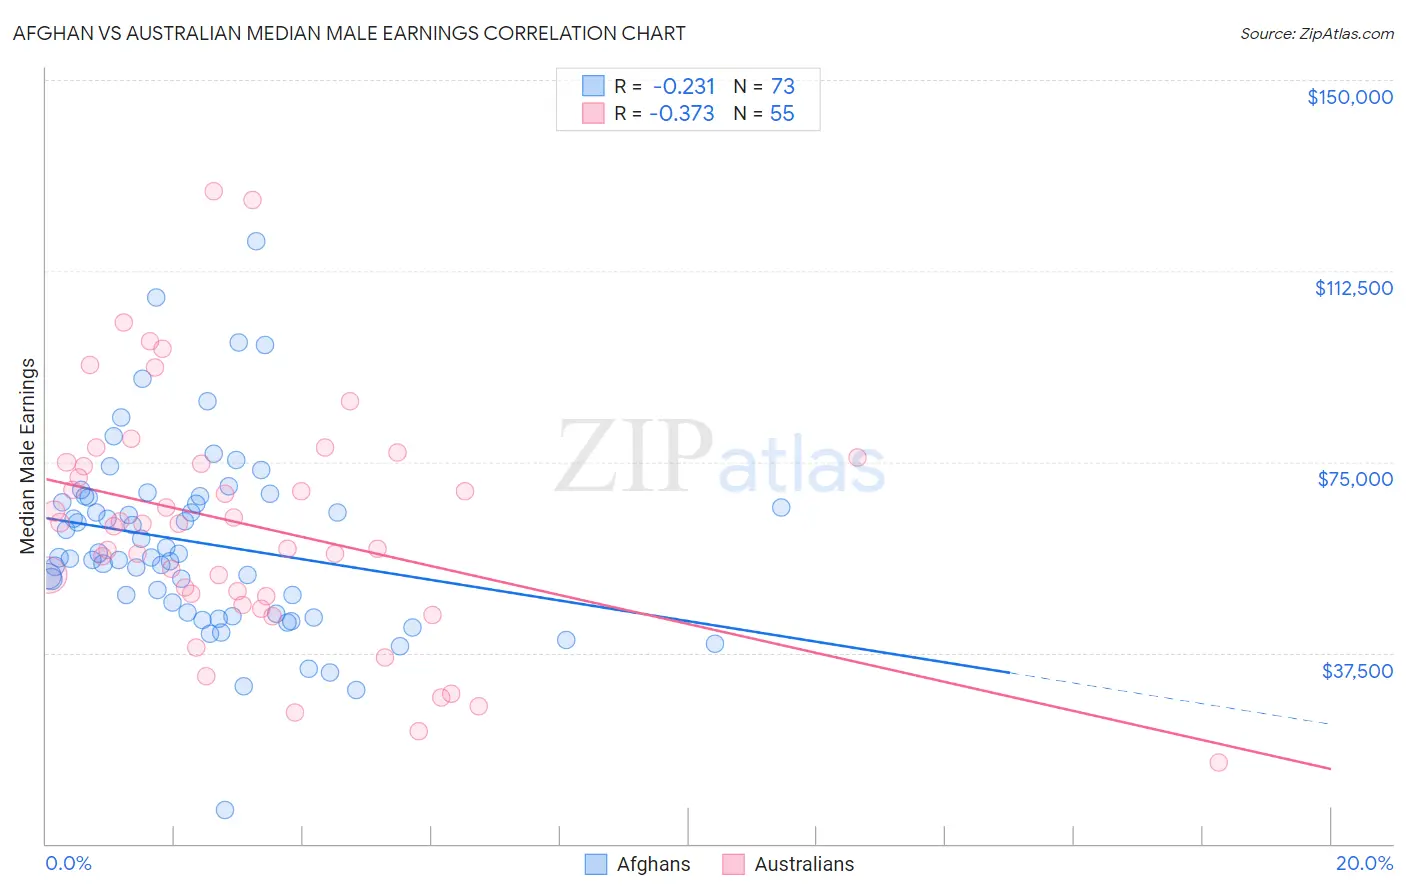
Afghan vs Australian Median Male Earnings Correlation Chart
The statistical analysis conducted on geographies consisting of 148,869,100 people shows a weak negative correlation between the proportion of Afghans and median male earnings in the United States with a correlation coefficient (R) of -0.231 and weighted average of $59,554. Similarly, the statistical analysis conducted on geographies consisting of 224,135,609 people shows a mild negative correlation between the proportion of Australians and median male earnings in the United States with a correlation coefficient (R) of -0.373 and weighted average of $62,857, a difference of 5.6%.
Median Male Earnings Correlation Summary
| Measurement | Afghan | Australian |
| Minimum | $6,707 | $15,945 |
| Maximum | $118,365 | $128,097 |
| Range | $111,658 | $112,152 |
| Mean | $59,002 | $62,501 |
| Median | $56,261 | $62,813 |
| Interquartile 25% (IQ1) | $45,293 | $48,594 |
| Interquartile 75% (IQ3) | $68,035 | $74,900 |
| Interquartile Range (IQR) | $22,742 | $26,306 |
| Standard Deviation (Sample) | $18,269 | $23,536 |
| Standard Deviation (Population) | $18,144 | $23,321 |
Similar Demographics by Median Male Earnings
Demographics Similar to Afghans by Median Male Earnings
In terms of median male earnings, the demographic groups most similar to Afghans are Italian ($59,551, a difference of 0.0%), Immigrants from England ($59,527, a difference of 0.050%), Macedonian ($59,522, a difference of 0.050%), Immigrants from Argentina ($59,491, a difference of 0.11%), and Immigrants from Italy ($59,691, a difference of 0.23%).
| Demographics | Rating | Rank | Median Male Earnings |
| Paraguayans | 99.5 /100 | #77 | Exceptional $59,975 |
| Immigrants | Egypt | 99.5 /100 | #78 | Exceptional $59,925 |
| Immigrants | Ukraine | 99.5 /100 | #79 | Exceptional $59,820 |
| Immigrants | Hungary | 99.5 /100 | #80 | Exceptional $59,806 |
| Ukrainians | 99.4 /100 | #81 | Exceptional $59,728 |
| Croatians | 99.4 /100 | #82 | Exceptional $59,715 |
| Immigrants | Italy | 99.4 /100 | #83 | Exceptional $59,691 |
| Afghans | 99.3 /100 | #84 | Exceptional $59,554 |
| Italians | 99.3 /100 | #85 | Exceptional $59,551 |
| Immigrants | England | 99.3 /100 | #86 | Exceptional $59,527 |
| Macedonians | 99.3 /100 | #87 | Exceptional $59,522 |
| Immigrants | Argentina | 99.3 /100 | #88 | Exceptional $59,491 |
| Immigrants | Moldova | 99.2 /100 | #89 | Exceptional $59,417 |
| Austrians | 99.2 /100 | #90 | Exceptional $59,359 |
| Laotians | 99.2 /100 | #91 | Exceptional $59,351 |
Demographics Similar to Australians by Median Male Earnings
In terms of median male earnings, the demographic groups most similar to Australians are Immigrants from South Africa ($62,899, a difference of 0.070%), Maltese ($62,953, a difference of 0.15%), Immigrants from Turkey ($62,728, a difference of 0.21%), Immigrants from Greece ($62,689, a difference of 0.27%), and Immigrants from Belarus ($62,658, a difference of 0.32%).
| Demographics | Rating | Rank | Median Male Earnings |
| Immigrants | Lithuania | 100.0 /100 | #33 | Exceptional $63,346 |
| Immigrants | Russia | 100.0 /100 | #34 | Exceptional $63,326 |
| Immigrants | Asia | 100.0 /100 | #35 | Exceptional $63,240 |
| Israelis | 100.0 /100 | #36 | Exceptional $63,228 |
| Immigrants | Sri Lanka | 100.0 /100 | #37 | Exceptional $63,099 |
| Maltese | 100.0 /100 | #38 | Exceptional $62,953 |
| Immigrants | South Africa | 100.0 /100 | #39 | Exceptional $62,899 |
| Australians | 100.0 /100 | #40 | Exceptional $62,857 |
| Immigrants | Turkey | 100.0 /100 | #41 | Exceptional $62,728 |
| Immigrants | Greece | 100.0 /100 | #42 | Exceptional $62,689 |
| Immigrants | Belarus | 100.0 /100 | #43 | Exceptional $62,658 |
| Cambodians | 100.0 /100 | #44 | Exceptional $62,516 |
| Bulgarians | 100.0 /100 | #45 | Exceptional $62,378 |
| Immigrants | Czechoslovakia | 99.9 /100 | #46 | Exceptional $62,217 |
| Immigrants | Austria | 99.9 /100 | #47 | Exceptional $62,164 |