Zip Codes with the Highest Percentage of Population with a Degree in Visual and Performing Arts in Valparaiso, IN
RELATED REPORTS & OPTIONS
Visual and Performing Arts
Valparaiso
Compare Zip Codes
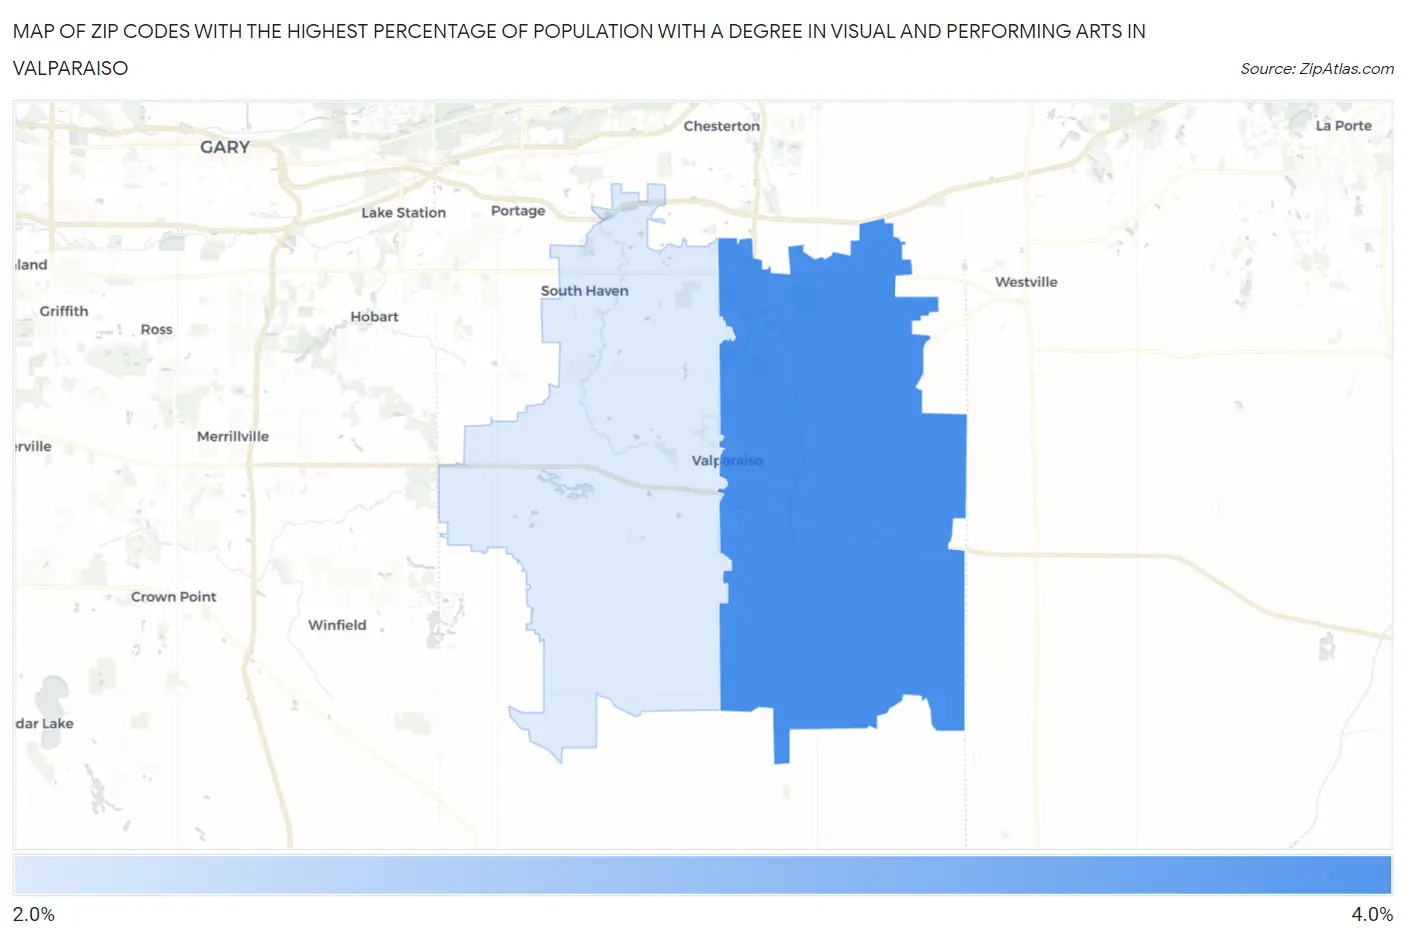
Map of Zip Codes with the Highest Percentage of Population with a Degree in Visual and Performing Arts in Valparaiso
2.1%
3.6%
Zip Codes with the Highest Percentage of Population with a Degree in Visual and Performing Arts in Valparaiso, IN
| Zip Code | % Graduates | vs State | vs National | |
| 1. | 46383 | 3.6% | 3.2%(+0.388)#204 | 4.3%(-0.619)#10,392 |
| 2. | 46385 | 2.1% | 3.2%(-1.17)#347 | 4.3%(-2.18)#16,175 |
1
Common Questions
What are the Top Zip Codes with the Highest Percentage of Population with a Degree in Visual and Performing Arts in Valparaiso, IN?
Top Zip Codes with the Highest Percentage of Population with a Degree in Visual and Performing Arts in Valparaiso, IN are:
What zip code has the Highest Percentage of Population with a Degree in Visual and Performing Arts in Valparaiso, IN?
46383 has the Highest Percentage of Population with a Degree in Visual and Performing Arts in Valparaiso, IN with 3.6%.
What is the Percentage of Population with a Degree in Visual and Performing Arts in Valparaiso, IN?
Percentage of Population with a Degree in Visual and Performing Arts in Valparaiso is 3.9%.
What is the Percentage of Population with a Degree in Visual and Performing Arts in Indiana?
Percentage of Population with a Degree in Visual and Performing Arts in Indiana is 3.2%.
What is the Percentage of Population with a Degree in Visual and Performing Arts in the United States?
Percentage of Population with a Degree in Visual and Performing Arts in the United States is 4.3%.