Zip Codes with the Highest Percentage of Population with a Degree in Visual and Performing Arts in Anderson, IN
RELATED REPORTS & OPTIONS
Visual and Performing Arts
Anderson
Compare Zip Codes
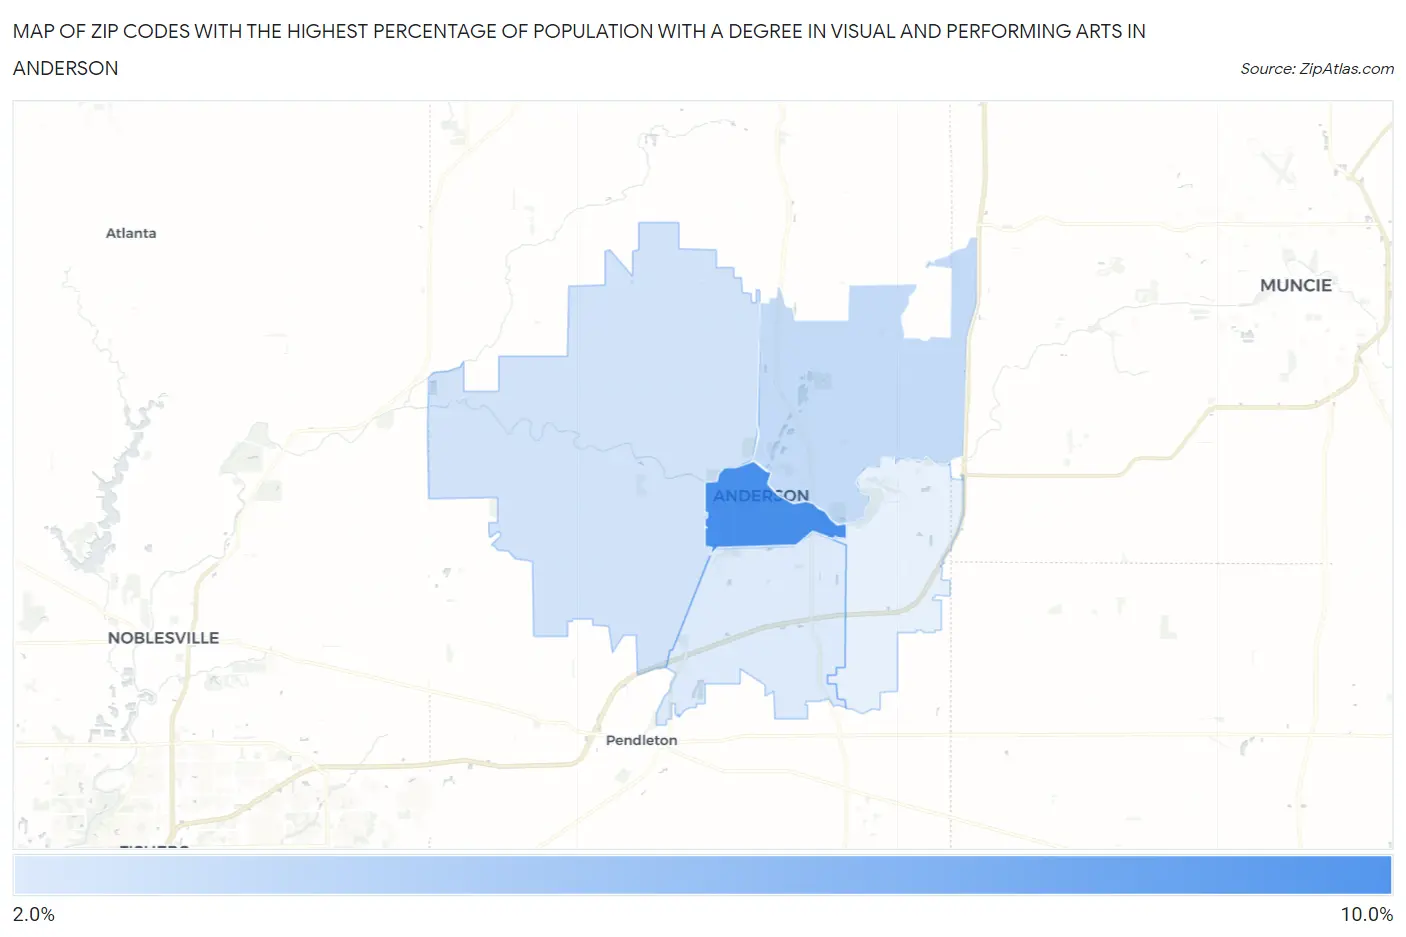
Map of Zip Codes with the Highest Percentage of Population with a Degree in Visual and Performing Arts in Anderson
2.6%
9.9%
Zip Codes with the Highest Percentage of Population with a Degree in Visual and Performing Arts in Anderson, IN
| Zip Code | % Graduates | vs State | vs National | |
| 1. | 46016 | 9.9% | 3.2%(+6.66)#41 | 4.3%(+5.65)#1,872 |
| 2. | 46012 | 3.8% | 3.2%(+0.514)#190 | 4.3%(-0.492)#9,977 |
| 3. | 46011 | 3.2% | 3.2%(-0.092)#248 | 4.3%(-1.10)#12,145 |
| 4. | 46013 | 2.6% | 3.2%(-0.659)#300 | 4.3%(-1.66)#14,305 |
1
Common Questions
What are the Top 3 Zip Codes with the Highest Percentage of Population with a Degree in Visual and Performing Arts in Anderson, IN?
Top 3 Zip Codes with the Highest Percentage of Population with a Degree in Visual and Performing Arts in Anderson, IN are:
What zip code has the Highest Percentage of Population with a Degree in Visual and Performing Arts in Anderson, IN?
46016 has the Highest Percentage of Population with a Degree in Visual and Performing Arts in Anderson, IN with 9.9%.
What is the Percentage of Population with a Degree in Visual and Performing Arts in Anderson, IN?
Percentage of Population with a Degree in Visual and Performing Arts in Anderson is 4.3%.
What is the Percentage of Population with a Degree in Visual and Performing Arts in Indiana?
Percentage of Population with a Degree in Visual and Performing Arts in Indiana is 3.2%.
What is the Percentage of Population with a Degree in Visual and Performing Arts in the United States?
Percentage of Population with a Degree in Visual and Performing Arts in the United States is 4.3%.