Zip Codes with the Highest Percentage of Population Employed in Farming, Fishing & Forestry in Peoria, IL
RELATED REPORTS & OPTIONS
Farming, Fishing & Forestry
Peoria
Compare Zip Codes
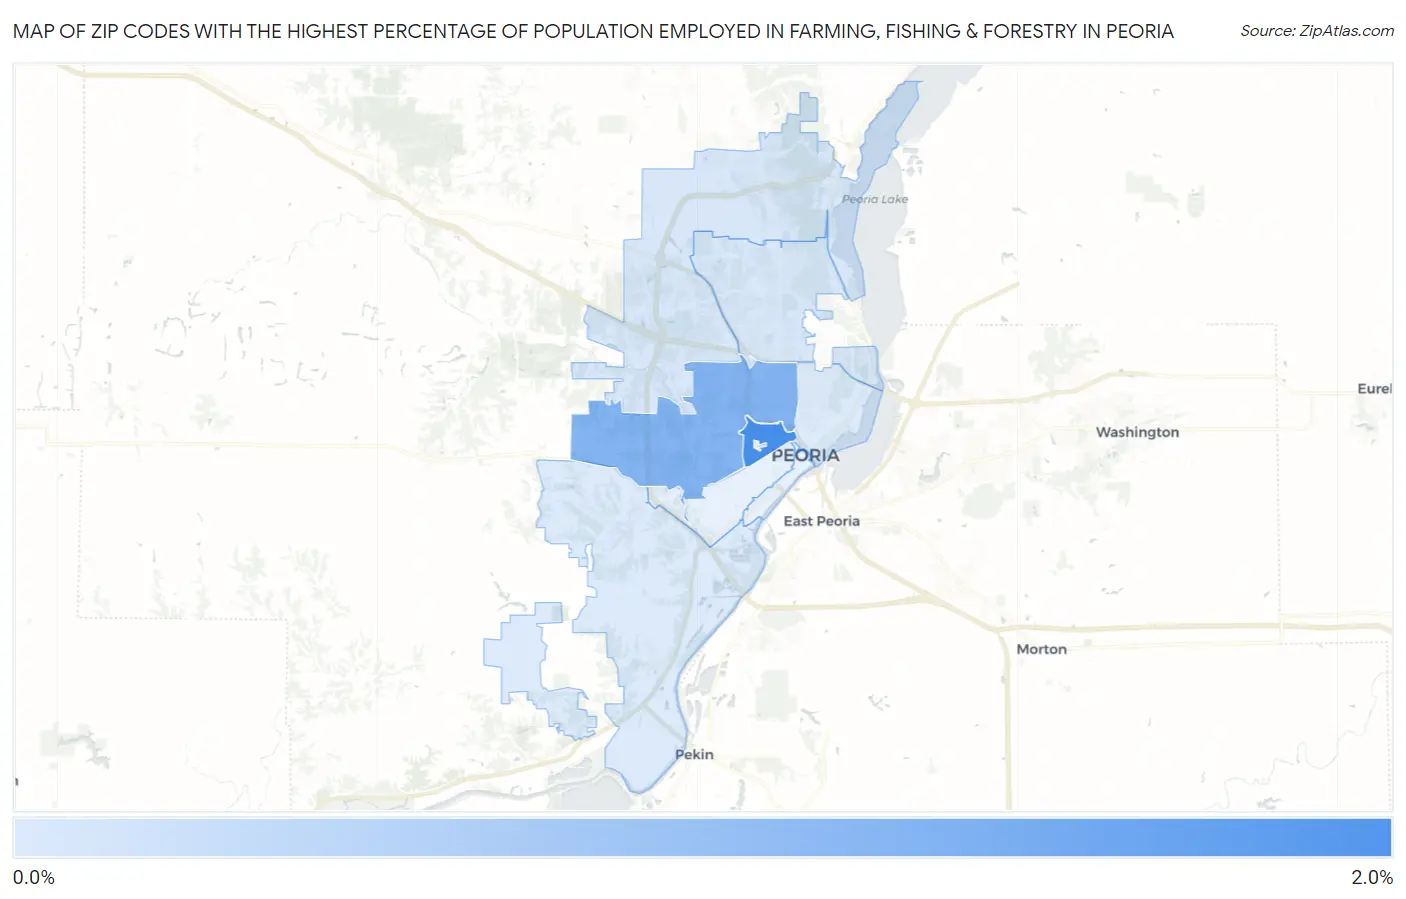
Map of Zip Codes with the Highest Percentage of Population Employed in Farming, Fishing & Forestry in Peoria
0.0%
2.0%
Zip Codes with the Highest Percentage of Population Employed in Farming, Fishing & Forestry in Peoria, IL
| Zip Code | % Employed | vs State | vs National | |
| 1. | 61606 | 1.8% | 0.31%(+1.52)#271 | 0.61%(+1.23)#6,937 |
| 2. | 61604 | 1.1% | 0.31%(+0.829)#380 | 0.61%(+0.534)#9,162 |
| 3. | 61615 | 0.17% | 0.31%(-0.137)#735 | 0.61%(-0.432)#16,528 |
| 4. | 61614 | 0.16% | 0.31%(-0.149)#740 | 0.61%(-0.444)#16,720 |
| 5. | 61603 | 0.13% | 0.31%(-0.183)#757 | 0.61%(-0.478)#17,308 |
| 6. | 61607 | 0.11% | 0.31%(-0.196)#768 | 0.61%(-0.491)#17,512 |
1
Common Questions
What are the Top 5 Zip Codes with the Highest Percentage of Population Employed in Farming, Fishing & Forestry in Peoria, IL?
Top 5 Zip Codes with the Highest Percentage of Population Employed in Farming, Fishing & Forestry in Peoria, IL are:
What zip code has the Highest Percentage of Population Employed in Farming, Fishing & Forestry in Peoria, IL?
61606 has the Highest Percentage of Population Employed in Farming, Fishing & Forestry in Peoria, IL with 1.8%.
What is the Percentage of Population Employed in Farming, Fishing & Forestry in Peoria, IL?
Percentage of Population Employed in Farming, Fishing & Forestry in Peoria is 0.53%.
What is the Percentage of Population Employed in Farming, Fishing & Forestry in Illinois?
Percentage of Population Employed in Farming, Fishing & Forestry in Illinois is 0.31%.
What is the Percentage of Population Employed in Farming, Fishing & Forestry in the United States?
Percentage of Population Employed in Farming, Fishing & Forestry in the United States is 0.61%.