Zip Codes with the Highest Percentage of Households Heated by Bottled Gas / Liquid Propane in Danville, IL
RELATED REPORTS & OPTIONS
Bottled Gas / LP Heating
Danville
Compare Zip Codes
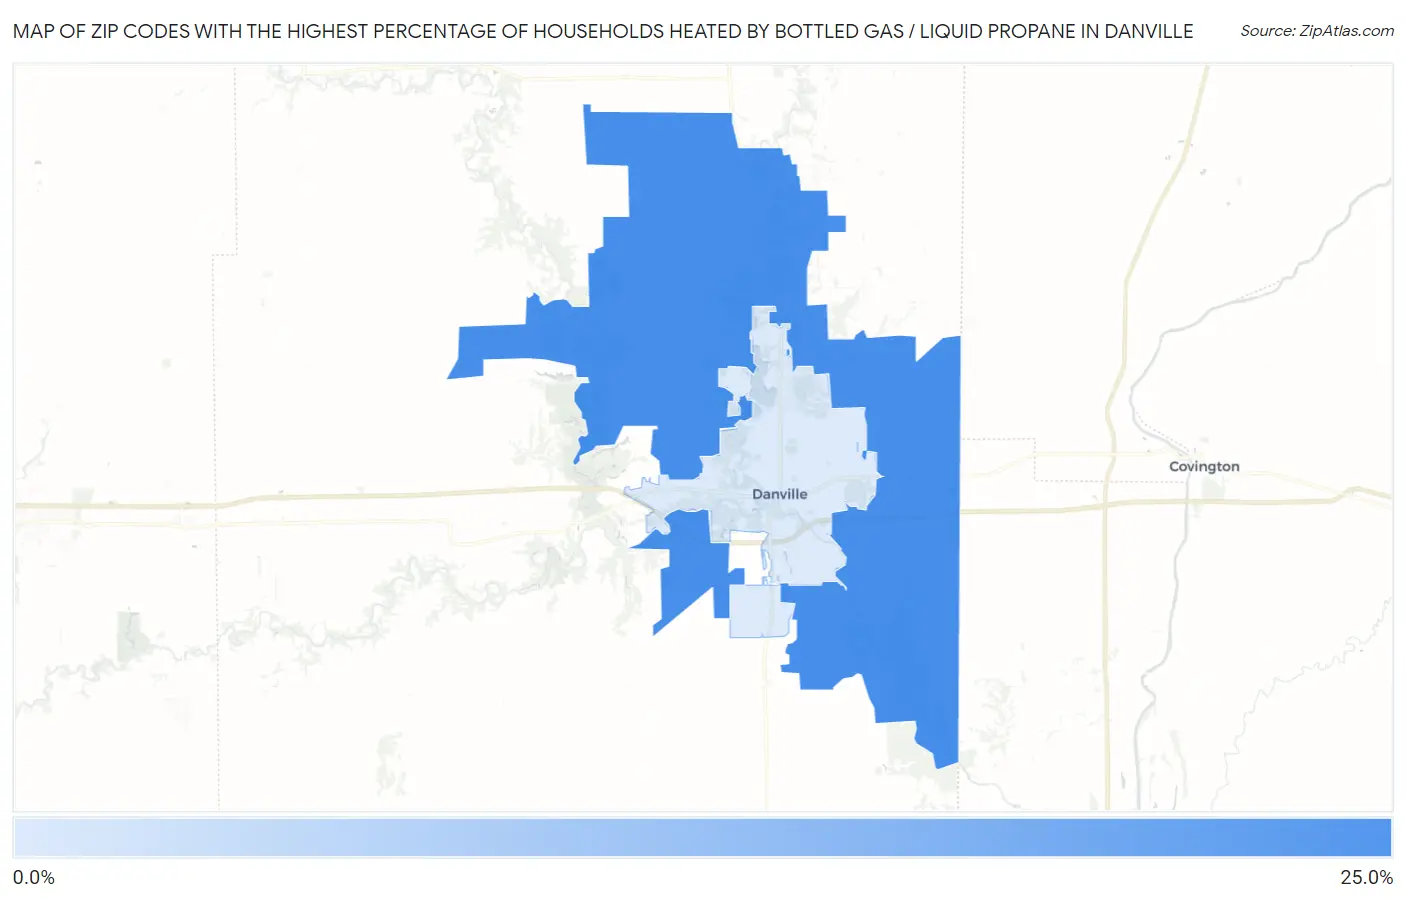
Map of Zip Codes with the Highest Percentage of Households Heated by Bottled Gas / Liquid Propane in Danville
0.0%
25.0%
Zip Codes with the Highest Percentage of Households Heated by Bottled Gas / Liquid Propane in Danville, IL
| Zip Code | Bottled Gas / LP Heating | vs State | vs National | |
| 1. | 61834 | 23.5% | 4.2%(+19.3)#414 | 4.9%(+18.6)#7,643 |
| 2. | 61832 | 0.70% | 4.2%(-3.50)#1,188 | 4.9%(-4.20)#27,842 |
1
Common Questions
What are the Top Zip Codes with the Highest Percentage of Households Heated by Bottled Gas / Liquid Propane in Danville, IL?
Top Zip Codes with the Highest Percentage of Households Heated by Bottled Gas / Liquid Propane in Danville, IL are:
What zip code has the Highest Percentage of Households Heated by Bottled Gas / Liquid Propane in Danville, IL?
61834 has the Highest Percentage of Households Heated by Bottled Gas / Liquid Propane in Danville, IL with 23.5%.
What is the Percentage of Households Heated by Bottled Gas / Liquid Propane in Danville, IL?
Percentage of Households Heated by Bottled Gas / Liquid Propane in Danville is 0.50%.
What is the Percentage of Households Heated by Bottled Gas / Liquid Propane in Illinois?
Percentage of Households Heated by Bottled Gas / Liquid Propane in Illinois is 4.2%.
What is the Percentage of Households Heated by Bottled Gas / Liquid Propane in the United States?
Percentage of Households Heated by Bottled Gas / Liquid Propane in the United States is 4.9%.