Zip Codes with the Highest Percentage of Population Employed in Food Preparation & Serving in Council Bluffs, IA
RELATED REPORTS & OPTIONS
Food Preparation & Serving
Council Bluffs
Compare Zip Codes
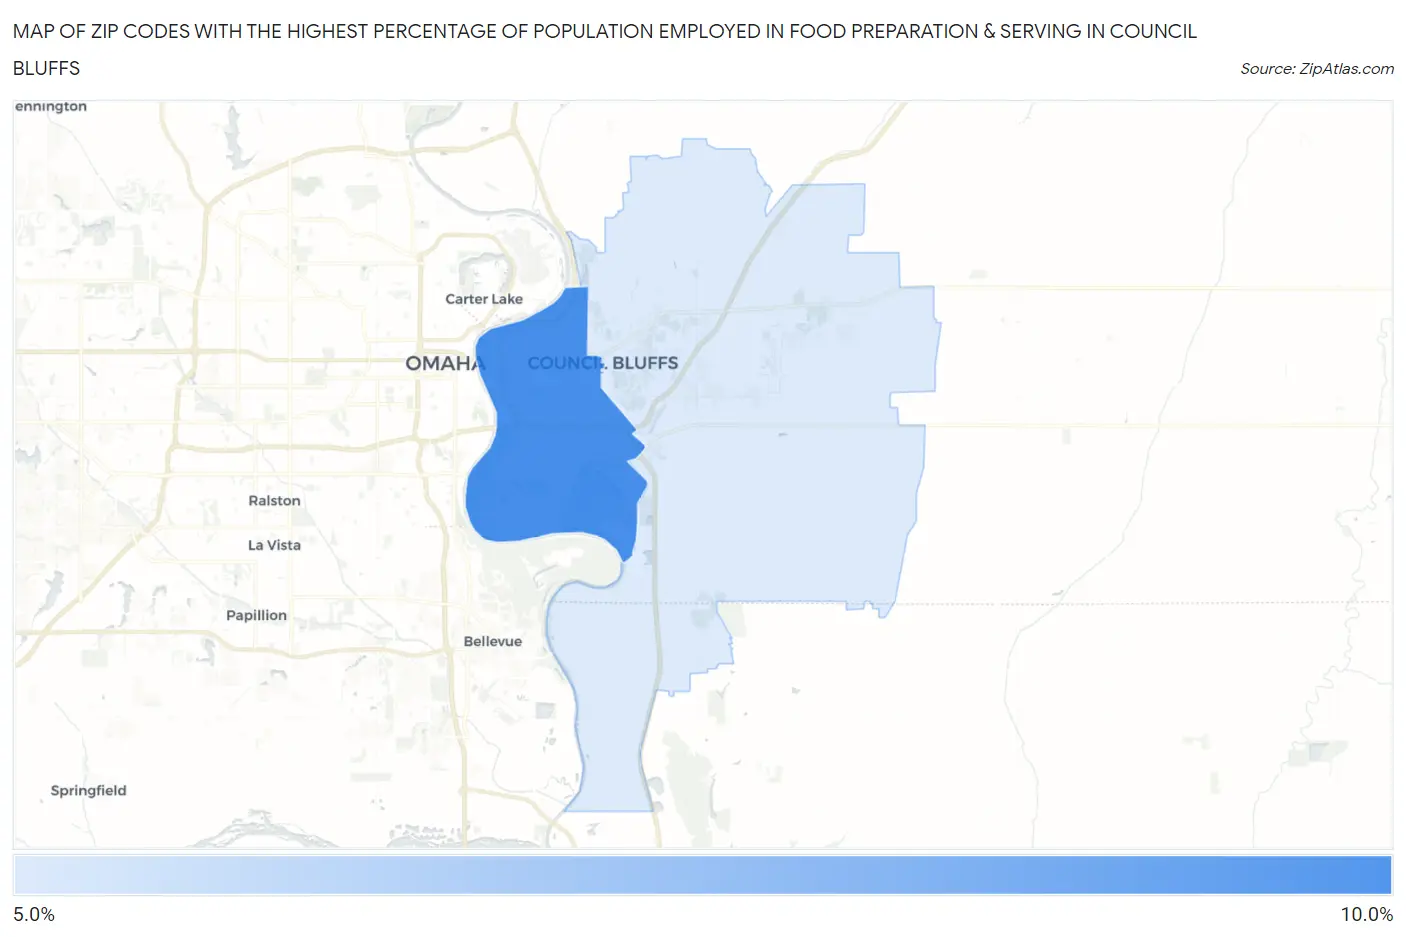
Map of Zip Codes with the Highest Percentage of Population Employed in Food Preparation & Serving in Council Bluffs
5.1%
8.0%
Zip Codes with the Highest Percentage of Population Employed in Food Preparation & Serving in Council Bluffs, IA
| Zip Code | % Employed | vs State | vs National | |
| 1. | 51501 | 8.0% | 5.1%(+2.91)#89 | 5.3%(+2.74)#4,694 |
| 2. | 51503 | 5.1% | 5.1%(-0.045)#287 | 5.3%(-0.218)#12,655 |
1
Common Questions
What are the Top Zip Codes with the Highest Percentage of Population Employed in Food Preparation & Serving in Council Bluffs, IA?
Top Zip Codes with the Highest Percentage of Population Employed in Food Preparation & Serving in Council Bluffs, IA are:
What zip code has the Highest Percentage of Population Employed in Food Preparation & Serving in Council Bluffs, IA?
51501 has the Highest Percentage of Population Employed in Food Preparation & Serving in Council Bluffs, IA with 8.0%.
What is the Percentage of Population Employed in Food Preparation & Serving in Council Bluffs, IA?
Percentage of Population Employed in Food Preparation & Serving in Council Bluffs is 7.1%.
What is the Percentage of Population Employed in Food Preparation & Serving in Iowa?
Percentage of Population Employed in Food Preparation & Serving in Iowa is 5.1%.
What is the Percentage of Population Employed in Food Preparation & Serving in the United States?
Percentage of Population Employed in Food Preparation & Serving in the United States is 5.3%.