Zip Codes with the Highest Percentage of Population Employed in Professional & Scientific Services in Davenport, IA
RELATED REPORTS & OPTIONS
Professional & Scientific Services
Davenport
Compare Zip Codes
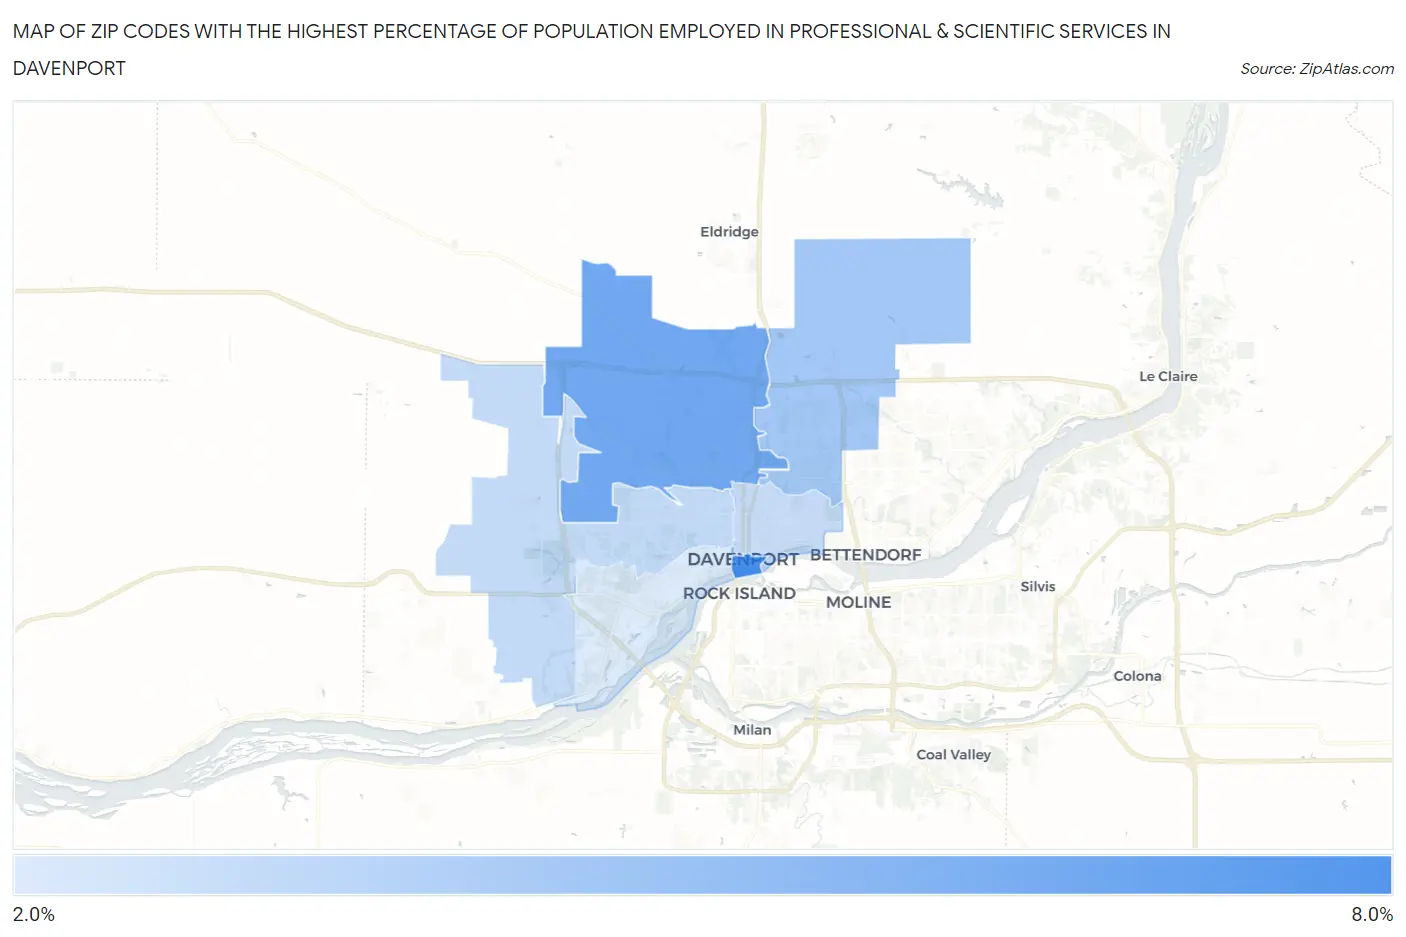
Map of Zip Codes with the Highest Percentage of Population Employed in Professional & Scientific Services in Davenport
0.0%
8.0%
Zip Codes with the Highest Percentage of Population Employed in Professional & Scientific Services in Davenport, IA
| Zip Code | % Employed | vs State | vs National | |
| 1. | 52801 | 6.4% | 4.4%(+1.97)#97 | 7.8%(-1.44)#9,190 |
| 2. | 52806 | 5.3% | 4.4%(+0.880)#158 | 7.8%(-2.53)#11,539 |
| 3. | 52807 | 4.0% | 4.4%(-0.428)#262 | 7.8%(-3.84)#15,092 |
| 4. | 52804 | 3.2% | 4.4%(-1.22)#344 | 7.8%(-4.64)#17,689 |
| 5. | 52803 | 3.1% | 4.4%(-1.36)#366 | 7.8%(-4.77)#18,202 |
| 6. | 52802 | 2.5% | 4.4%(-1.89)#448 | 7.8%(-5.31)#20,047 |
1
Common Questions
What are the Top 5 Zip Codes with the Highest Percentage of Population Employed in Professional & Scientific Services in Davenport, IA?
Top 5 Zip Codes with the Highest Percentage of Population Employed in Professional & Scientific Services in Davenport, IA are:
What zip code has the Highest Percentage of Population Employed in Professional & Scientific Services in Davenport, IA?
52801 has the Highest Percentage of Population Employed in Professional & Scientific Services in Davenport, IA with 6.4%.
What is the Percentage of Population Employed in Professional & Scientific Services in Davenport, IA?
Percentage of Population Employed in Professional & Scientific Services in Davenport is 3.9%.
What is the Percentage of Population Employed in Professional & Scientific Services in Iowa?
Percentage of Population Employed in Professional & Scientific Services in Iowa is 4.4%.
What is the Percentage of Population Employed in Professional & Scientific Services in the United States?
Percentage of Population Employed in Professional & Scientific Services in the United States is 7.8%.