Zip Codes with the Highest Percentage of Renter-Occupied Units in Davenport, IA
RELATED REPORTS & OPTIONS
Highest Renter-Occupied
Davenport
Compare Zip Codes
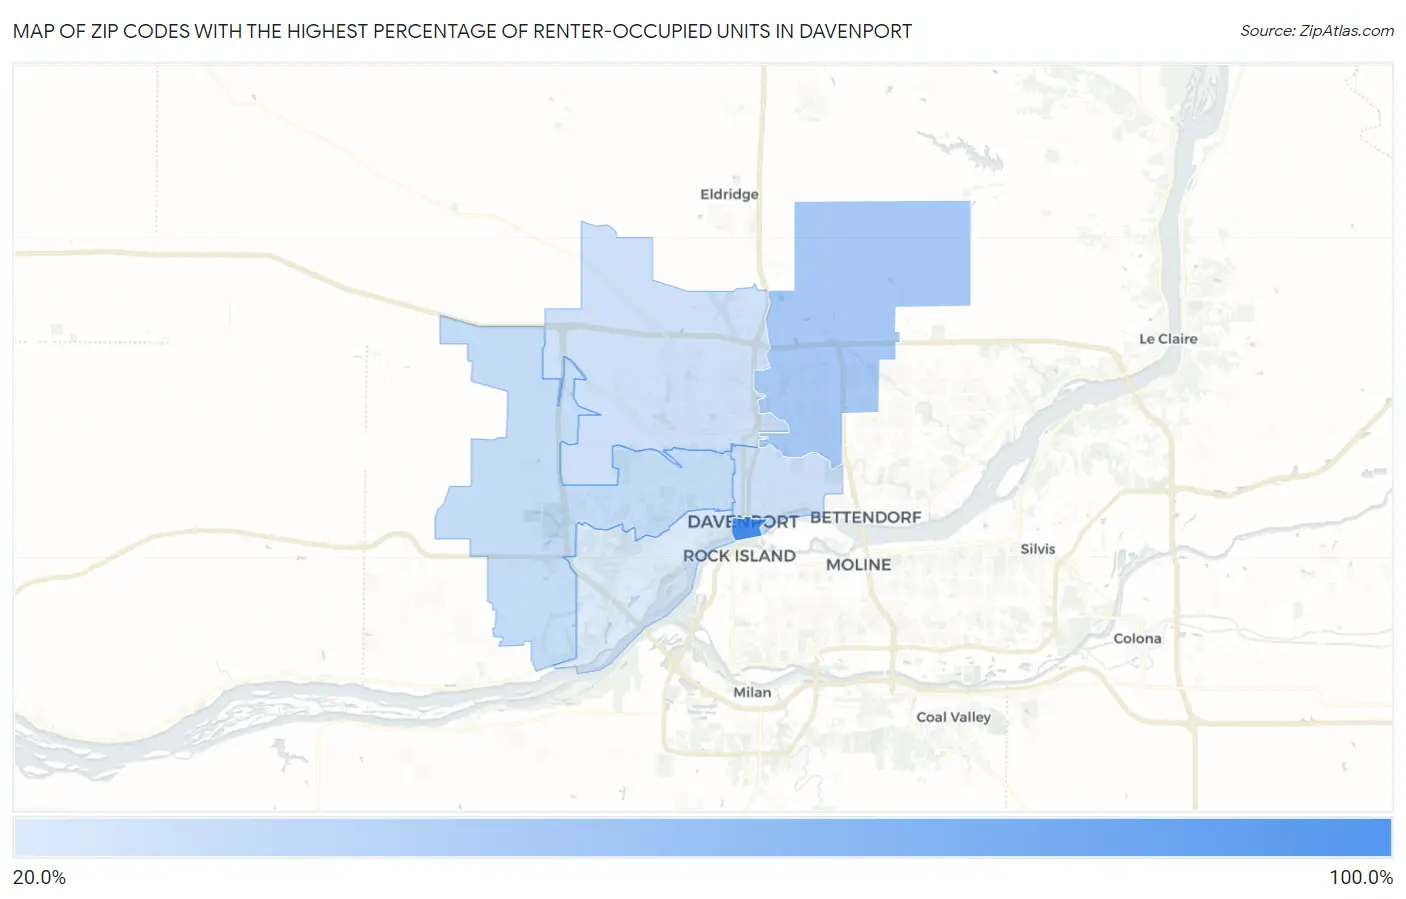
Map of Zip Codes with the Highest Percentage of Renter-Occupied Units in Davenport
0.0%
100.0%
Zip Codes with the Highest Percentage of Renter-Occupied Units in Davenport, IA
| Zip Code | % Renter-Occupied | vs State | vs National | |
| 1. | 52801 | 100.0% | 28.5%(+71.5)#2 | 35.2%(+64.8)#80 |
| 2. | 52807 | 49.5% | 28.5%(+21.0)#21 | 35.2%(+14.3)#3,184 |
| 3. | 52804 | 36.0% | 28.5%(+7.50)#72 | 35.2%(+0.798)#6,911 |
| 4. | 52803 | 31.9% | 28.5%(+3.43)#105 | 35.2%(-3.27)#8,908 |
| 5. | 52806 | 31.9% | 28.5%(+3.42)#106 | 35.2%(-3.28)#8,912 |
| 6. | 52802 | 26.7% | 28.5%(-1.77)#200 | 35.2%(-8.47)#12,299 |
1
Common Questions
What are the Top 5 Zip Codes with the Highest Percentage of Renter-Occupied Units in Davenport, IA?
Top 5 Zip Codes with the Highest Percentage of Renter-Occupied Units in Davenport, IA are:
What zip code has the Highest Percentage of Renter-Occupied Units in Davenport, IA?
52801 has the Highest Percentage of Renter-Occupied Units in Davenport, IA with 100.0%.
What is the Percentage of Renter-Occupied Units in Davenport, IA?
Percentage of Renter-Occupied Units in Davenport is 37.8%.
What is the Percentage of Renter-Occupied Units in Iowa?
Percentage of Renter-Occupied Units in Iowa is 28.5%.
What is the Percentage of Renter-Occupied Units in the United States?
Percentage of Renter-Occupied Units in the United States is 35.2%.