Zip Codes with the Highest Percentage of Population Employed in Farming, Fishing & Forestry in Davenport, IA
RELATED REPORTS & OPTIONS
Farming, Fishing & Forestry
Davenport
Compare Zip Codes
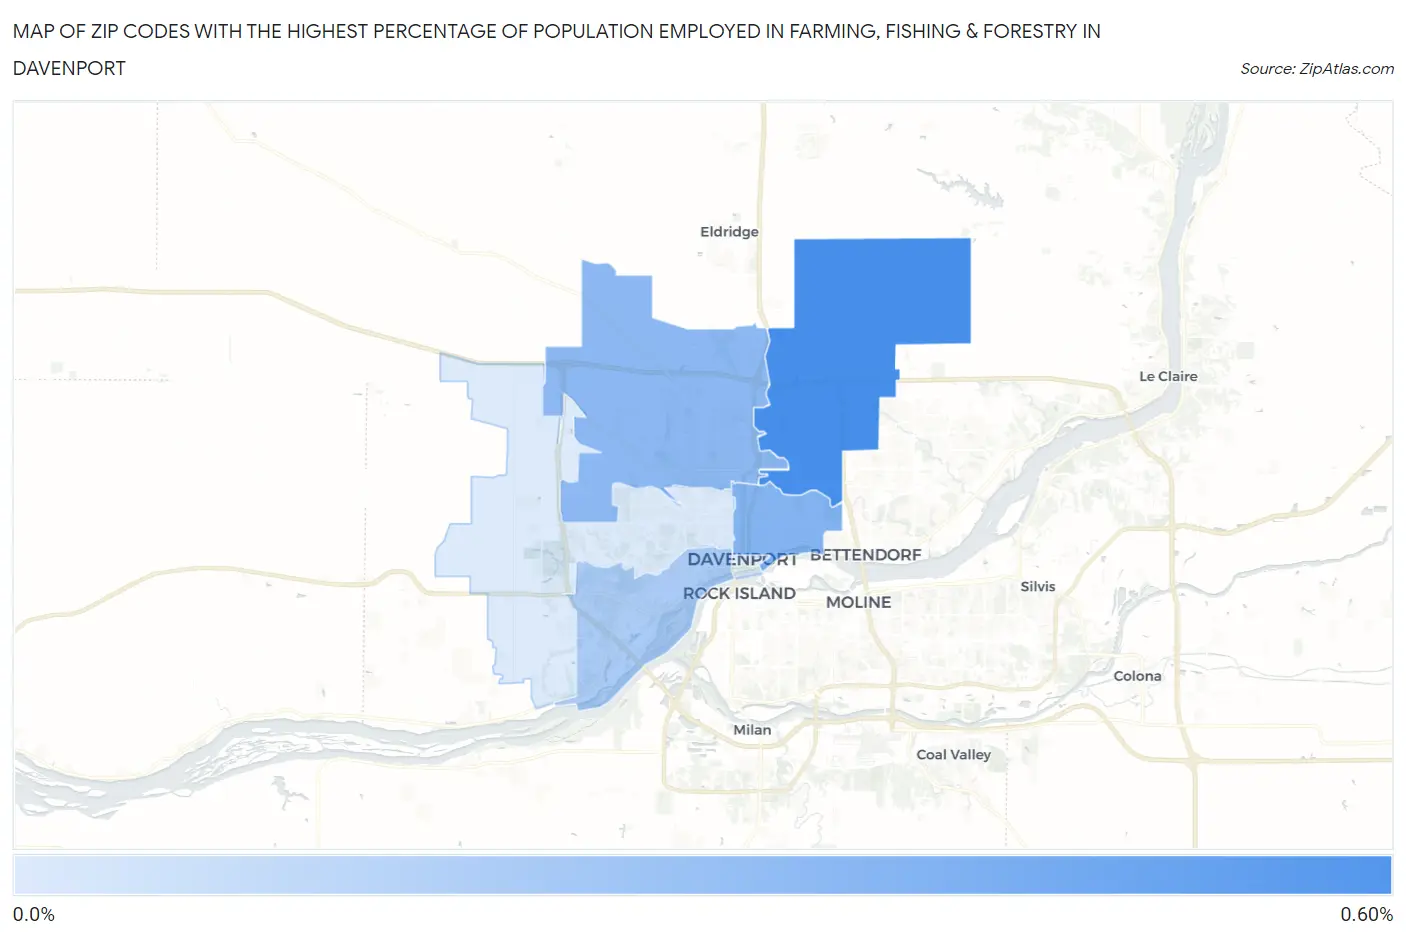
Map of Zip Codes with the Highest Percentage of Population Employed in Farming, Fishing & Forestry in Davenport
0.0%
0.60%
Zip Codes with the Highest Percentage of Population Employed in Farming, Fishing & Forestry in Davenport, IA
| Zip Code | % Employed | vs State | vs National | |
| 1. | 52807 | 0.51% | 1.1%(-0.584)#599 | 0.61%(-0.101)#12,793 |
| 2. | 52803 | 0.32% | 1.1%(-0.773)#662 | 0.61%(-0.290)#14,647 |
| 3. | 52806 | 0.30% | 1.1%(-0.793)#668 | 0.61%(-0.310)#14,890 |
| 4. | 52802 | 0.21% | 1.1%(-0.879)#690 | 0.61%(-0.396)#15,996 |
| 5. | 52804 | 0.054% | 1.1%(-1.03)#710 | 0.61%(-0.551)#18,594 |
1
Common Questions
What are the Top 5 Zip Codes with the Highest Percentage of Population Employed in Farming, Fishing & Forestry in Davenport, IA?
Top 5 Zip Codes with the Highest Percentage of Population Employed in Farming, Fishing & Forestry in Davenport, IA are:
What zip code has the Highest Percentage of Population Employed in Farming, Fishing & Forestry in Davenport, IA?
52807 has the Highest Percentage of Population Employed in Farming, Fishing & Forestry in Davenport, IA with 0.51%.
What is the Percentage of Population Employed in Farming, Fishing & Forestry in Davenport, IA?
Percentage of Population Employed in Farming, Fishing & Forestry in Davenport is 0.27%.
What is the Percentage of Population Employed in Farming, Fishing & Forestry in Iowa?
Percentage of Population Employed in Farming, Fishing & Forestry in Iowa is 1.1%.
What is the Percentage of Population Employed in Farming, Fishing & Forestry in the United States?
Percentage of Population Employed in Farming, Fishing & Forestry in the United States is 0.61%.