Tongan vs Iranian Family Households
COMPARE
Tongan
Iranian
Family Households
Family Households Comparison
Tongans
Iranians
69.6%
FAMILY HOUSEHOLDS
100.0/ 100
METRIC RATING
3rd/ 347
METRIC RANK
63.9%
FAMILY HOUSEHOLDS
13.5/ 100
METRIC RATING
202nd/ 347
METRIC RANK
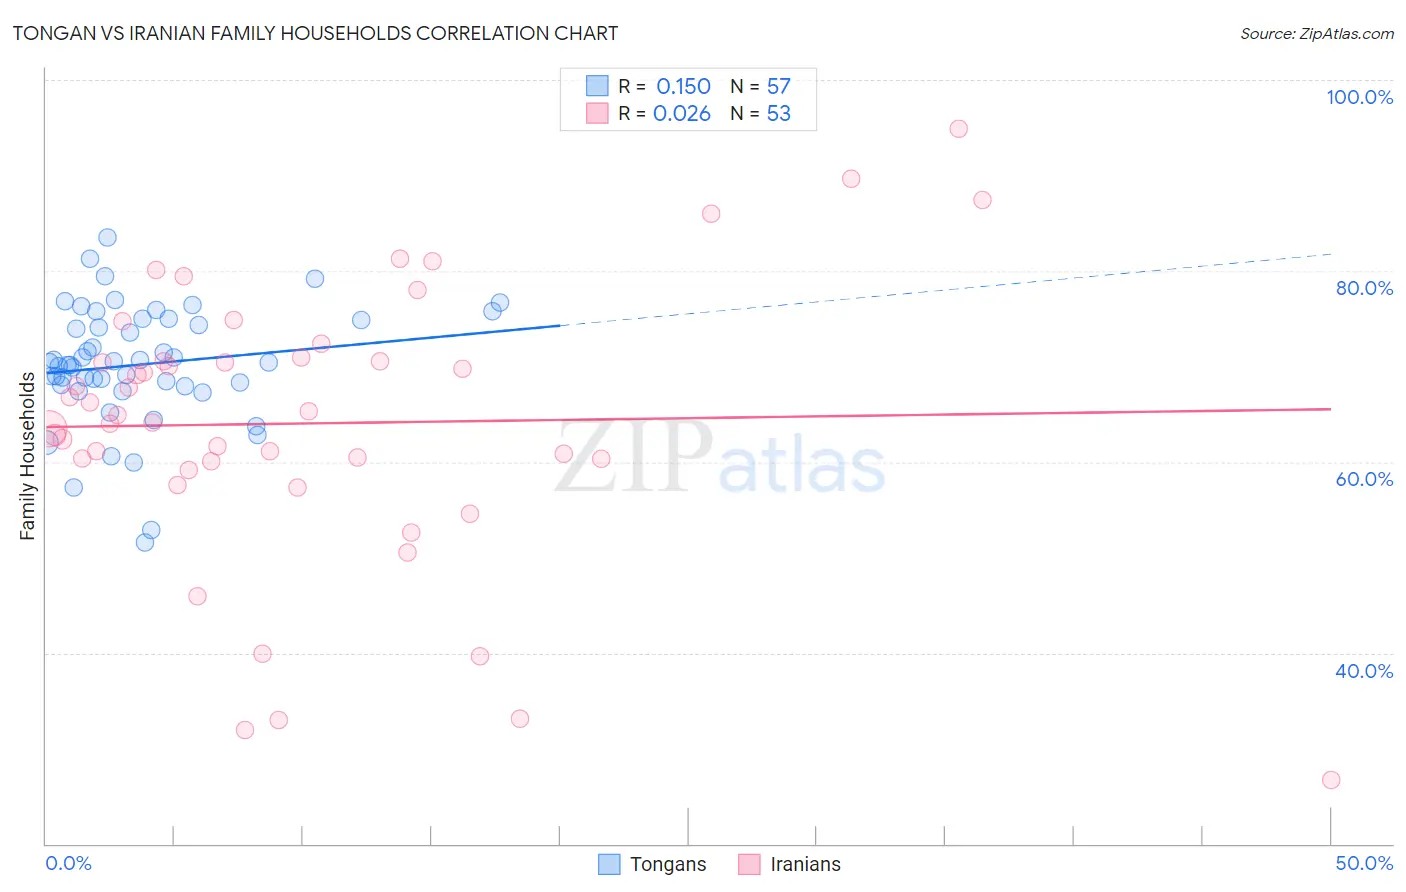
Tongan vs Iranian Family Households Correlation Chart
The statistical analysis conducted on geographies consisting of 102,870,916 people shows a poor positive correlation between the proportion of Tongans and percentage of family households in the United States with a correlation coefficient (R) of 0.150 and weighted average of 69.6%. Similarly, the statistical analysis conducted on geographies consisting of 316,654,989 people shows no correlation between the proportion of Iranians and percentage of family households in the United States with a correlation coefficient (R) of 0.026 and weighted average of 63.9%, a difference of 9.0%.
Family Households Correlation Summary
| Measurement | Tongan | Iranian |
| Minimum | 51.6% | 26.7% |
| Maximum | 83.5% | 94.9% |
| Range | 31.9% | 68.2% |
| Mean | 70.2% | 64.0% |
| Median | 70.4% | 64.9% |
| Interquartile 25% (IQ1) | 68.0% | 59.6% |
| Interquartile 75% (IQ3) | 74.9% | 70.7% |
| Interquartile Range (IQR) | 7.0% | 11.2% |
| Standard Deviation (Sample) | 6.3% | 14.6% |
| Standard Deviation (Population) | 6.2% | 14.4% |
Similar Demographics by Family Households
Demographics Similar to Tongans by Family Households
In terms of family households, the demographic groups most similar to Tongans are Yakama (69.3%, a difference of 0.44%), Yuman (69.3%, a difference of 0.47%), Immigrants from Mexico (69.1%, a difference of 0.71%), Mexican (69.0%, a difference of 0.92%), and Immigrants from Fiji (68.8%, a difference of 1.2%).
| Demographics | Rating | Rank | Family Households |
| Yup'ik | 100 /100 | #1 | Exceptional 72.4% |
| Spanish American Indians | 100.0 /100 | #2 | Exceptional 71.2% |
| Tongans | 100.0 /100 | #3 | Exceptional 69.6% |
| Yakama | 100.0 /100 | #4 | Exceptional 69.3% |
| Yuman | 100.0 /100 | #5 | Exceptional 69.3% |
| Immigrants | Mexico | 100.0 /100 | #6 | Exceptional 69.1% |
| Mexicans | 100.0 /100 | #7 | Exceptional 69.0% |
| Immigrants | Fiji | 100.0 /100 | #8 | Exceptional 68.8% |
| Native Hawaiians | 100.0 /100 | #9 | Exceptional 68.4% |
| Immigrants | Philippines | 100.0 /100 | #10 | Exceptional 68.3% |
| Immigrants | Central America | 100.0 /100 | #11 | Exceptional 68.3% |
| Koreans | 100.0 /100 | #12 | Exceptional 68.3% |
| Pueblo | 100.0 /100 | #13 | Exceptional 68.2% |
| Immigrants | Cuba | 100.0 /100 | #14 | Exceptional 68.2% |
| Assyrians/Chaldeans/Syriacs | 100.0 /100 | #15 | Exceptional 68.2% |
Demographics Similar to Iranians by Family Households
In terms of family households, the demographic groups most similar to Iranians are Norwegian (63.9%, a difference of 0.010%), Immigrants from Uruguay (63.9%, a difference of 0.020%), Brazilian (63.9%, a difference of 0.030%), Immigrants from Lithuania (63.9%, a difference of 0.040%), and Nigerian (63.9%, a difference of 0.060%).
| Demographics | Rating | Rank | Family Households |
| Immigrants | North America | 20.0 /100 | #195 | Poor 64.0% |
| Immigrants | Canada | 19.2 /100 | #196 | Poor 64.0% |
| Seminole | 18.9 /100 | #197 | Poor 64.0% |
| Poles | 18.9 /100 | #198 | Poor 64.0% |
| Slavs | 18.6 /100 | #199 | Poor 64.0% |
| Immigrants | Malaysia | 17.9 /100 | #200 | Poor 64.0% |
| Immigrants | Eastern Europe | 17.2 /100 | #201 | Poor 64.0% |
| Iranians | 13.5 /100 | #202 | Poor 63.9% |
| Norwegians | 13.2 /100 | #203 | Poor 63.9% |
| Immigrants | Uruguay | 12.8 /100 | #204 | Poor 63.9% |
| Brazilians | 12.4 /100 | #205 | Poor 63.9% |
| Immigrants | Lithuania | 12.1 /100 | #206 | Poor 63.9% |
| Nigerians | 11.5 /100 | #207 | Poor 63.9% |
| Immigrants | Bangladesh | 11.4 /100 | #208 | Poor 63.9% |
| Sierra Leoneans | 11.2 /100 | #209 | Poor 63.9% |