Swiss vs Immigrants from Zimbabwe Family Households
COMPARE
Swiss
Immigrants from Zimbabwe
Family Households
Family Households Comparison
Swiss
Immigrants from Zimbabwe
65.2%
FAMILY HOUSEHOLDS
98.6/ 100
METRIC RATING
96th/ 347
METRIC RANK
63.5%
FAMILY HOUSEHOLDS
2.0/ 100
METRIC RATING
238th/ 347
METRIC RANK
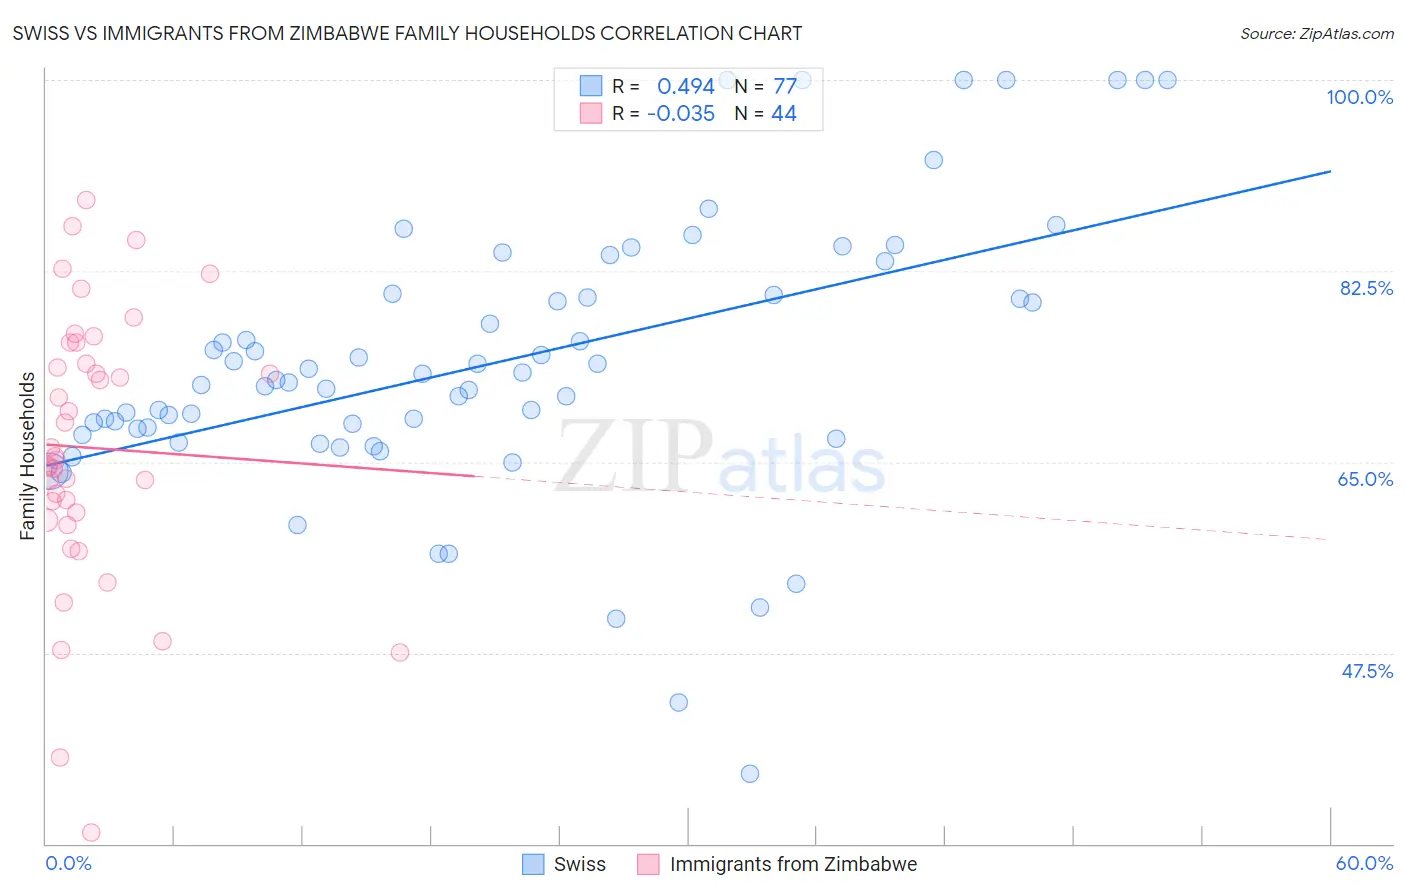
Swiss vs Immigrants from Zimbabwe Family Households Correlation Chart
The statistical analysis conducted on geographies consisting of 464,763,466 people shows a moderate positive correlation between the proportion of Swiss and percentage of family households in the United States with a correlation coefficient (R) of 0.494 and weighted average of 65.2%. Similarly, the statistical analysis conducted on geographies consisting of 117,791,116 people shows no correlation between the proportion of Immigrants from Zimbabwe and percentage of family households in the United States with a correlation coefficient (R) of -0.035 and weighted average of 63.5%, a difference of 2.8%.
Family Households Correlation Summary
| Measurement | Swiss | Immigrants from Zimbabwe |
| Minimum | 36.4% | 31.0% |
| Maximum | 100.0% | 89.0% |
| Range | 63.6% | 57.9% |
| Mean | 74.1% | 66.3% |
| Median | 72.5% | 65.4% |
| Interquartile 25% (IQ1) | 67.7% | 60.0% |
| Interquartile 75% (IQ3) | 80.3% | 75.0% |
| Interquartile Range (IQR) | 12.6% | 15.0% |
| Standard Deviation (Sample) | 12.7% | 12.5% |
| Standard Deviation (Population) | 12.7% | 12.4% |
Similar Demographics by Family Households
Demographics Similar to Swiss by Family Households
In terms of family households, the demographic groups most similar to Swiss are Guatemalan (65.2%, a difference of 0.0%), Immigrants from Portugal (65.2%, a difference of 0.010%), Immigrants from Poland (65.2%, a difference of 0.030%), Immigrants from Syria (65.2%, a difference of 0.040%), and Hopi (65.3%, a difference of 0.050%).
| Demographics | Rating | Rank | Family Households |
| Immigrants | Caribbean | 99.1 /100 | #89 | Exceptional 65.3% |
| Immigrants | Laos | 99.1 /100 | #90 | Exceptional 65.3% |
| Crow | 98.9 /100 | #91 | Exceptional 65.3% |
| Hopi | 98.8 /100 | #92 | Exceptional 65.3% |
| Guyanese | 98.8 /100 | #93 | Exceptional 65.3% |
| Immigrants | Poland | 98.7 /100 | #94 | Exceptional 65.2% |
| Immigrants | Portugal | 98.6 /100 | #95 | Exceptional 65.2% |
| Swiss | 98.6 /100 | #96 | Exceptional 65.2% |
| Guatemalans | 98.6 /100 | #97 | Exceptional 65.2% |
| Immigrants | Syria | 98.4 /100 | #98 | Exceptional 65.2% |
| Central American Indians | 98.3 /100 | #99 | Exceptional 65.2% |
| Haitians | 98.1 /100 | #100 | Exceptional 65.2% |
| Chileans | 98.1 /100 | #101 | Exceptional 65.2% |
| Immigrants | Sri Lanka | 98.0 /100 | #102 | Exceptional 65.1% |
| Indians (Asian) | 97.9 /100 | #103 | Exceptional 65.1% |
Demographics Similar to Immigrants from Zimbabwe by Family Households
In terms of family households, the demographic groups most similar to Immigrants from Zimbabwe are Ghanaian (63.5%, a difference of 0.010%), Comanche (63.5%, a difference of 0.010%), Albanian (63.5%, a difference of 0.020%), Aleut (63.4%, a difference of 0.030%), and South African (63.4%, a difference of 0.030%).
| Demographics | Rating | Rank | Family Households |
| Immigrants | Greece | 2.9 /100 | #231 | Tragic 63.5% |
| Immigrants | Northern Africa | 2.6 /100 | #232 | Tragic 63.5% |
| Immigrants | Armenia | 2.6 /100 | #233 | Tragic 63.5% |
| Finns | 2.3 /100 | #234 | Tragic 63.5% |
| Albanians | 2.2 /100 | #235 | Tragic 63.5% |
| Ghanaians | 2.1 /100 | #236 | Tragic 63.5% |
| Comanche | 2.1 /100 | #237 | Tragic 63.5% |
| Immigrants | Zimbabwe | 2.0 /100 | #238 | Tragic 63.5% |
| Aleuts | 1.9 /100 | #239 | Tragic 63.4% |
| South Africans | 1.9 /100 | #240 | Tragic 63.4% |
| Immigrants | St. Vincent and the Grenadines | 1.9 /100 | #241 | Tragic 63.4% |
| Immigrants | Israel | 1.8 /100 | #242 | Tragic 63.4% |
| Immigrants | Czechoslovakia | 1.8 /100 | #243 | Tragic 63.4% |
| Eastern Europeans | 1.6 /100 | #244 | Tragic 63.4% |
| Immigrants | Dominica | 1.6 /100 | #245 | Tragic 63.4% |