Swedish vs Japanese Family Households
COMPARE
Swedish
Japanese
Family Households
Family Households Comparison
Swedes
Japanese
64.5%
FAMILY HOUSEHOLDS
69.8/ 100
METRIC RATING
153rd/ 347
METRIC RANK
65.9%
FAMILY HOUSEHOLDS
99.9/ 100
METRIC RATING
68th/ 347
METRIC RANK
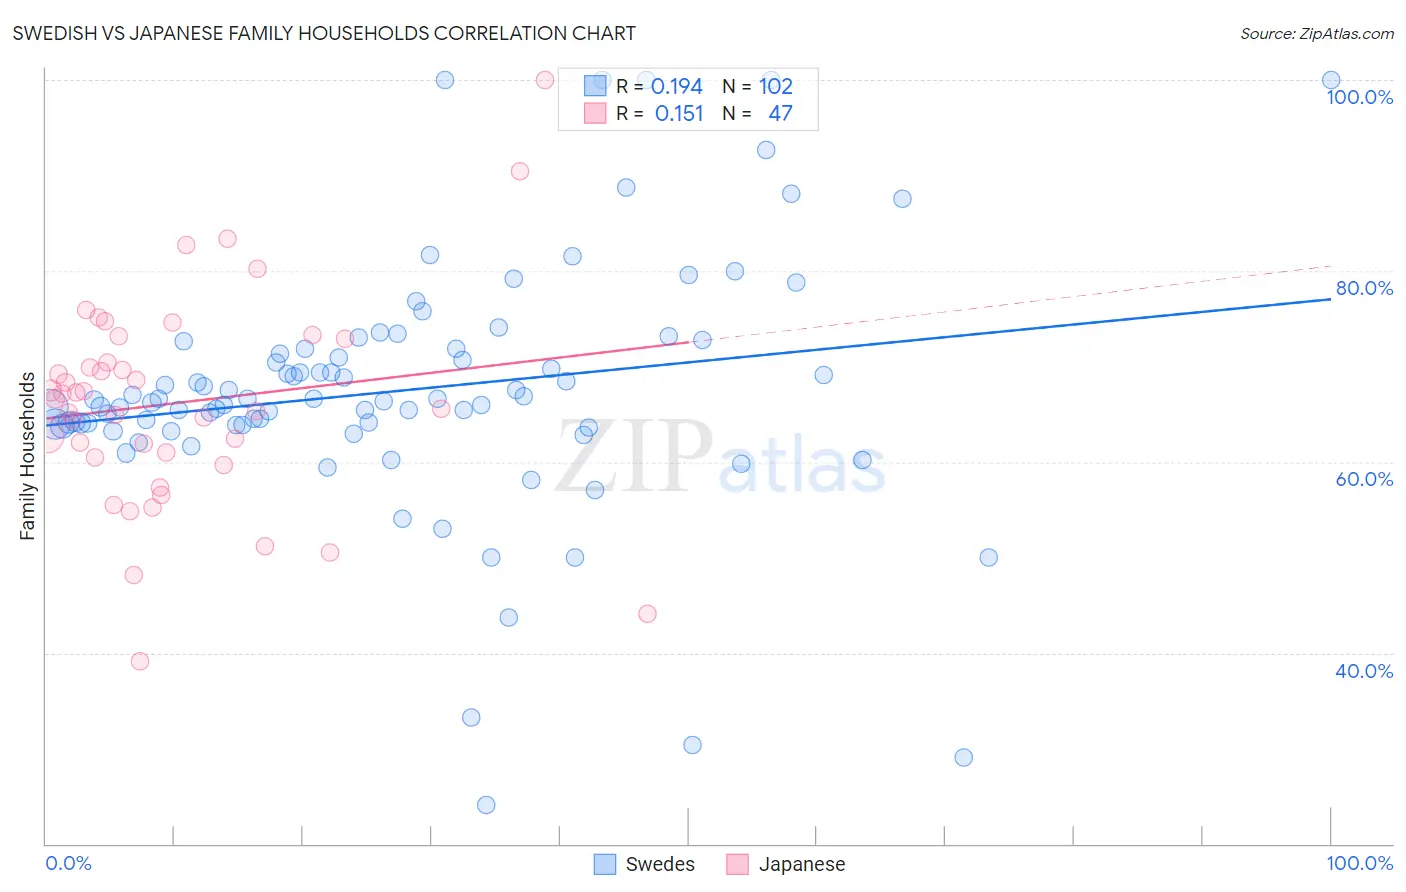
Swedish vs Japanese Family Households Correlation Chart
The statistical analysis conducted on geographies consisting of 538,762,235 people shows a poor positive correlation between the proportion of Swedes and percentage of family households in the United States with a correlation coefficient (R) of 0.194 and weighted average of 64.5%. Similarly, the statistical analysis conducted on geographies consisting of 249,074,128 people shows a poor positive correlation between the proportion of Japanese and percentage of family households in the United States with a correlation coefficient (R) of 0.151 and weighted average of 65.9%, a difference of 2.2%.
Family Households Correlation Summary
| Measurement | Swedish | Japanese |
| Minimum | 24.0% | 39.1% |
| Maximum | 100.0% | 100.0% |
| Range | 76.0% | 60.9% |
| Mean | 67.5% | 66.2% |
| Median | 66.4% | 66.6% |
| Interquartile 25% (IQ1) | 63.8% | 60.5% |
| Interquartile 75% (IQ3) | 71.8% | 72.9% |
| Interquartile Range (IQR) | 8.0% | 12.4% |
| Standard Deviation (Sample) | 13.1% | 11.2% |
| Standard Deviation (Population) | 13.0% | 11.1% |
Similar Demographics by Family Households
Demographics Similar to Swedes by Family Households
In terms of family households, the demographic groups most similar to Swedes are Scottish (64.5%, a difference of 0.020%), Austrian (64.5%, a difference of 0.020%), Uruguayan (64.5%, a difference of 0.030%), Czech (64.5%, a difference of 0.040%), and Canadian (64.4%, a difference of 0.050%).
| Demographics | Rating | Rank | Family Households |
| Immigrants | Romania | 77.0 /100 | #146 | Good 64.6% |
| Immigrants | Chile | 76.5 /100 | #147 | Good 64.6% |
| Delaware | 76.3 /100 | #148 | Good 64.6% |
| Sioux | 76.3 /100 | #149 | Good 64.6% |
| Romanians | 75.3 /100 | #150 | Good 64.5% |
| Syrians | 75.2 /100 | #151 | Good 64.5% |
| Scottish | 70.9 /100 | #152 | Good 64.5% |
| Swedes | 69.8 /100 | #153 | Good 64.5% |
| Austrians | 68.5 /100 | #154 | Good 64.5% |
| Uruguayans | 67.7 /100 | #155 | Good 64.5% |
| Czechs | 67.0 /100 | #156 | Good 64.5% |
| Canadians | 66.6 /100 | #157 | Good 64.4% |
| Lebanese | 66.4 /100 | #158 | Good 64.4% |
| Germans | 65.8 /100 | #159 | Good 64.4% |
| Immigrants | Moldova | 65.2 /100 | #160 | Good 64.4% |
Demographics Similar to Japanese by Family Households
In terms of family households, the demographic groups most similar to Japanese are Fijian (65.9%, a difference of 0.020%), Filipino (65.9%, a difference of 0.020%), Malaysian (65.9%, a difference of 0.030%), Immigrants from Afghanistan (65.9%, a difference of 0.040%), and Costa Rican (65.9%, a difference of 0.060%).
| Demographics | Rating | Rank | Family Households |
| Danes | 100.0 /100 | #61 | Exceptional 66.0% |
| Central Americans | 100.0 /100 | #62 | Exceptional 66.0% |
| Immigrants | Indonesia | 100.0 /100 | #63 | Exceptional 66.0% |
| Pima | 99.9 /100 | #64 | Exceptional 65.9% |
| Costa Ricans | 99.9 /100 | #65 | Exceptional 65.9% |
| Fijians | 99.9 /100 | #66 | Exceptional 65.9% |
| Filipinos | 99.9 /100 | #67 | Exceptional 65.9% |
| Japanese | 99.9 /100 | #68 | Exceptional 65.9% |
| Malaysians | 99.9 /100 | #69 | Exceptional 65.9% |
| Immigrants | Afghanistan | 99.9 /100 | #70 | Exceptional 65.9% |
| Bhutanese | 99.9 /100 | #71 | Exceptional 65.9% |
| Portuguese | 99.9 /100 | #72 | Exceptional 65.8% |
| Laotians | 99.9 /100 | #73 | Exceptional 65.8% |
| Burmese | 99.9 /100 | #74 | Exceptional 65.7% |
| Houma | 99.9 /100 | #75 | Exceptional 65.7% |