Swedish vs Japanese Births to Unmarried Women
COMPARE
Swedish
Japanese
Births to Unmarried Women
Births to Unmarried Women Comparison
Swedes
Japanese
29.6%
BIRTHS TO UNMARRIED WOMEN
93.8/ 100
METRIC RATING
106th/ 347
METRIC RANK
35.2%
BIRTHS TO UNMARRIED WOMEN
0.9/ 100
METRIC RATING
243rd/ 347
METRIC RANK
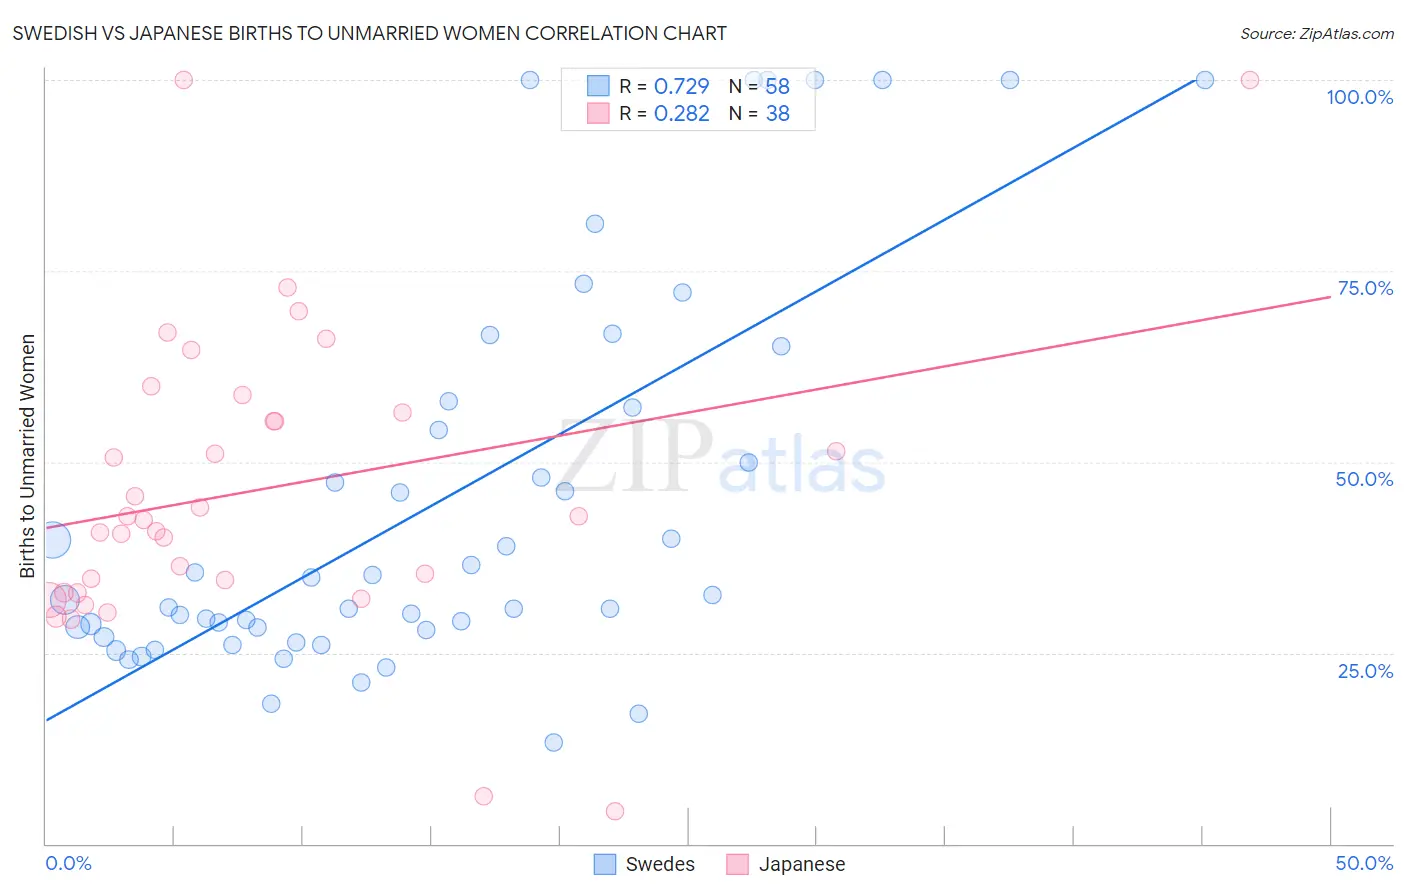
Swedish vs Japanese Births to Unmarried Women Correlation Chart
The statistical analysis conducted on geographies consisting of 481,429,855 people shows a strong positive correlation between the proportion of Swedes and percentage of births to unmarried women in the United States with a correlation coefficient (R) of 0.729 and weighted average of 29.6%. Similarly, the statistical analysis conducted on geographies consisting of 240,312,984 people shows a weak positive correlation between the proportion of Japanese and percentage of births to unmarried women in the United States with a correlation coefficient (R) of 0.282 and weighted average of 35.2%, a difference of 18.6%.
Births to Unmarried Women Correlation Summary
| Measurement | Swedish | Japanese |
| Minimum | 13.2% | 4.3% |
| Maximum | 100.0% | 100.0% |
| Range | 86.8% | 95.7% |
| Mean | 44.7% | 46.3% |
| Median | 32.3% | 42.6% |
| Interquartile 25% (IQ1) | 28.0% | 32.9% |
| Interquartile 75% (IQ3) | 57.1% | 56.4% |
| Interquartile Range (IQR) | 29.1% | 23.5% |
| Standard Deviation (Sample) | 25.5% | 19.9% |
| Standard Deviation (Population) | 25.2% | 19.7% |
Similar Demographics by Births to Unmarried Women
Demographics Similar to Swedes by Births to Unmarried Women
In terms of births to unmarried women, the demographic groups most similar to Swedes are Immigrants from Brazil (29.6%, a difference of 0.010%), Paraguayan (29.7%, a difference of 0.10%), Greek (29.7%, a difference of 0.14%), Immigrants from Ethiopia (29.7%, a difference of 0.17%), and Immigrants from Nepal (29.6%, a difference of 0.25%).
| Demographics | Rating | Rank | Births to Unmarried Women |
| Immigrants | Denmark | 95.3 /100 | #99 | Exceptional 29.4% |
| Luxembourgers | 95.2 /100 | #100 | Exceptional 29.4% |
| Immigrants | Northern Africa | 94.7 /100 | #101 | Exceptional 29.5% |
| Australians | 94.6 /100 | #102 | Exceptional 29.5% |
| Lebanese | 94.4 /100 | #103 | Exceptional 29.5% |
| Lithuanians | 94.4 /100 | #104 | Exceptional 29.6% |
| Immigrants | Nepal | 94.3 /100 | #105 | Exceptional 29.6% |
| Swedes | 93.8 /100 | #106 | Exceptional 29.6% |
| Immigrants | Brazil | 93.7 /100 | #107 | Exceptional 29.6% |
| Paraguayans | 93.5 /100 | #108 | Exceptional 29.7% |
| Greeks | 93.4 /100 | #109 | Exceptional 29.7% |
| Immigrants | Ethiopia | 93.4 /100 | #110 | Exceptional 29.7% |
| Immigrants | Hungary | 93.0 /100 | #111 | Exceptional 29.7% |
| Basques | 93.0 /100 | #112 | Exceptional 29.7% |
| Scandinavians | 92.7 /100 | #113 | Exceptional 29.8% |
Demographics Similar to Japanese by Births to Unmarried Women
In terms of births to unmarried women, the demographic groups most similar to Japanese are Guyanese (35.2%, a difference of 0.060%), Shoshone (35.3%, a difference of 0.40%), Indonesian (35.0%, a difference of 0.49%), Nigerian (35.3%, a difference of 0.51%), and Immigrants from Guyana (35.0%, a difference of 0.59%).
| Demographics | Rating | Rank | Births to Unmarried Women |
| Immigrants | Cameroon | 1.6 /100 | #236 | Tragic 34.7% |
| Marshallese | 1.6 /100 | #237 | Tragic 34.8% |
| Immigrants | Cambodia | 1.6 /100 | #238 | Tragic 34.8% |
| Sierra Leoneans | 1.4 /100 | #239 | Tragic 34.9% |
| Immigrants | Middle Africa | 1.2 /100 | #240 | Tragic 34.9% |
| Immigrants | Guyana | 1.2 /100 | #241 | Tragic 35.0% |
| Indonesians | 1.2 /100 | #242 | Tragic 35.0% |
| Japanese | 0.9 /100 | #243 | Tragic 35.2% |
| Guyanese | 0.9 /100 | #244 | Tragic 35.2% |
| Shoshone | 0.8 /100 | #245 | Tragic 35.3% |
| Nigerians | 0.7 /100 | #246 | Tragic 35.3% |
| Immigrants | Nigeria | 0.7 /100 | #247 | Tragic 35.4% |
| Immigrants | Nonimmigrants | 0.6 /100 | #248 | Tragic 35.5% |
| Bermudans | 0.6 /100 | #249 | Tragic 35.5% |
| Mexican American Indians | 0.4 /100 | #250 | Tragic 35.7% |