Sudanese vs Immigrants from Belarus Married-couple Households
COMPARE
Sudanese
Immigrants from Belarus
Married-couple Households
Married-couple Households Comparison
Sudanese
Immigrants from Belarus
42.1%
MARRIED-COUPLE HOUSEHOLDS
0.0/ 100
METRIC RATING
289th/ 347
METRIC RANK
47.2%
MARRIED-COUPLE HOUSEHOLDS
83.8/ 100
METRIC RATING
143rd/ 347
METRIC RANK
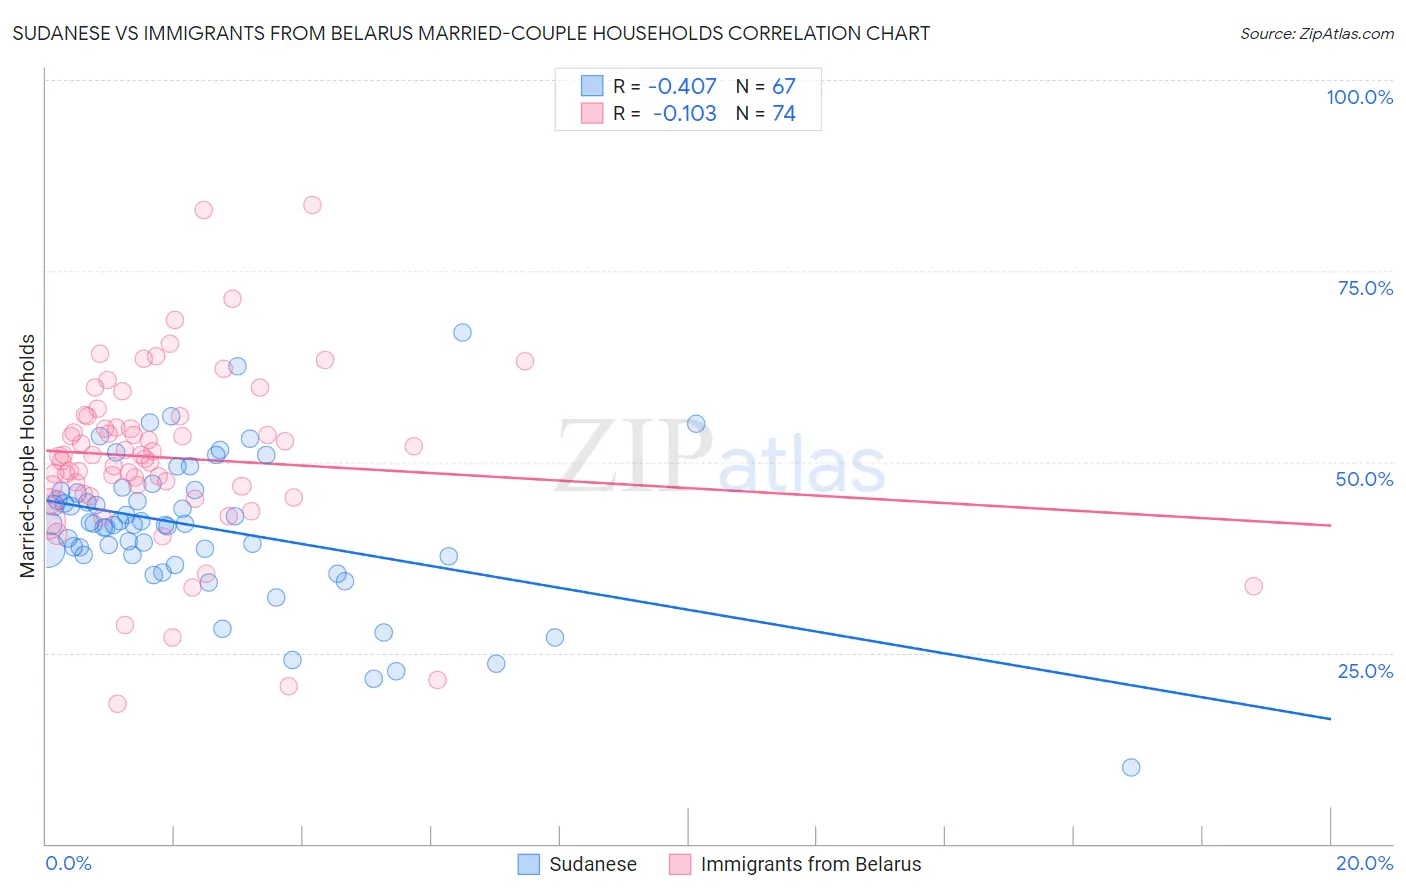
Sudanese vs Immigrants from Belarus Married-couple Households Correlation Chart
The statistical analysis conducted on geographies consisting of 110,110,852 people shows a moderate negative correlation between the proportion of Sudanese and percentage of married-couple family households in the United States with a correlation coefficient (R) of -0.407 and weighted average of 42.1%. Similarly, the statistical analysis conducted on geographies consisting of 150,189,140 people shows a poor negative correlation between the proportion of Immigrants from Belarus and percentage of married-couple family households in the United States with a correlation coefficient (R) of -0.103 and weighted average of 47.2%, a difference of 12.1%.
Married-couple Households Correlation Summary
| Measurement | Sudanese | Immigrants from Belarus |
| Minimum | 10.0% | 18.4% |
| Maximum | 66.9% | 83.7% |
| Range | 56.9% | 65.3% |
| Mean | 41.4% | 50.5% |
| Median | 41.9% | 50.8% |
| Interquartile 25% (IQ1) | 37.8% | 45.9% |
| Interquartile 75% (IQ3) | 46.1% | 55.9% |
| Interquartile Range (IQR) | 8.3% | 10.0% |
| Standard Deviation (Sample) | 9.5% | 11.7% |
| Standard Deviation (Population) | 9.5% | 11.6% |
Similar Demographics by Married-couple Households
Demographics Similar to Sudanese by Married-couple Households
In terms of married-couple households, the demographic groups most similar to Sudanese are Honduran (42.1%, a difference of 0.050%), Immigrants from Eritrea (42.1%, a difference of 0.060%), Paiute (42.1%, a difference of 0.060%), Indonesian (42.0%, a difference of 0.11%), and Chippewa (42.1%, a difference of 0.14%).
| Demographics | Rating | Rank | Married-couple Households |
| Bermudans | 0.0 /100 | #282 | Tragic 42.4% |
| Inupiat | 0.0 /100 | #283 | Tragic 42.4% |
| Cheyenne | 0.0 /100 | #284 | Tragic 42.3% |
| Ghanaians | 0.0 /100 | #285 | Tragic 42.2% |
| Belizeans | 0.0 /100 | #286 | Tragic 42.2% |
| Chippewa | 0.0 /100 | #287 | Tragic 42.1% |
| Immigrants | Eritrea | 0.0 /100 | #288 | Tragic 42.1% |
| Sudanese | 0.0 /100 | #289 | Tragic 42.1% |
| Hondurans | 0.0 /100 | #290 | Tragic 42.1% |
| Paiute | 0.0 /100 | #291 | Tragic 42.1% |
| Indonesians | 0.0 /100 | #292 | Tragic 42.0% |
| Menominee | 0.0 /100 | #293 | Tragic 42.0% |
| Immigrants | Yemen | 0.0 /100 | #294 | Tragic 42.0% |
| Kiowa | 0.0 /100 | #295 | Tragic 42.0% |
| Immigrants | Sudan | 0.0 /100 | #296 | Tragic 41.9% |
Demographics Similar to Immigrants from Belarus by Married-couple Households
In terms of married-couple households, the demographic groups most similar to Immigrants from Belarus are Spaniard (47.2%, a difference of 0.020%), Mexican (47.1%, a difference of 0.020%), Costa Rican (47.2%, a difference of 0.040%), Spanish (47.2%, a difference of 0.050%), and Immigrants from Sweden (47.2%, a difference of 0.060%).
| Demographics | Rating | Rank | Married-couple Households |
| New Zealanders | 85.3 /100 | #136 | Excellent 47.2% |
| Immigrants | Malaysia | 85.2 /100 | #137 | Excellent 47.2% |
| Immigrants | Afghanistan | 85.1 /100 | #138 | Excellent 47.2% |
| Immigrants | Sweden | 84.7 /100 | #139 | Excellent 47.2% |
| Spanish | 84.5 /100 | #140 | Excellent 47.2% |
| Costa Ricans | 84.4 /100 | #141 | Excellent 47.2% |
| Spaniards | 84.1 /100 | #142 | Excellent 47.2% |
| Immigrants | Belarus | 83.8 /100 | #143 | Excellent 47.2% |
| Mexicans | 83.4 /100 | #144 | Excellent 47.1% |
| Slovenes | 81.7 /100 | #145 | Excellent 47.1% |
| Immigrants | Western Europe | 81.6 /100 | #146 | Excellent 47.1% |
| Immigrants | Syria | 81.6 /100 | #147 | Excellent 47.1% |
| Icelanders | 79.5 /100 | #148 | Good 47.0% |
| Paraguayans | 78.7 /100 | #149 | Good 47.0% |
| Immigrants | Russia | 77.6 /100 | #150 | Good 47.0% |