Immigrants from Colombia vs Immigrants from Belarus Married-couple Households
COMPARE
Immigrants from Colombia
Immigrants from Belarus
Married-couple Households
Married-couple Households Comparison
Immigrants from Colombia
Immigrants from Belarus
46.4%
MARRIED-COUPLE HOUSEHOLDS
46.1/ 100
METRIC RATING
175th/ 347
METRIC RANK
47.2%
MARRIED-COUPLE HOUSEHOLDS
83.8/ 100
METRIC RATING
143rd/ 347
METRIC RANK
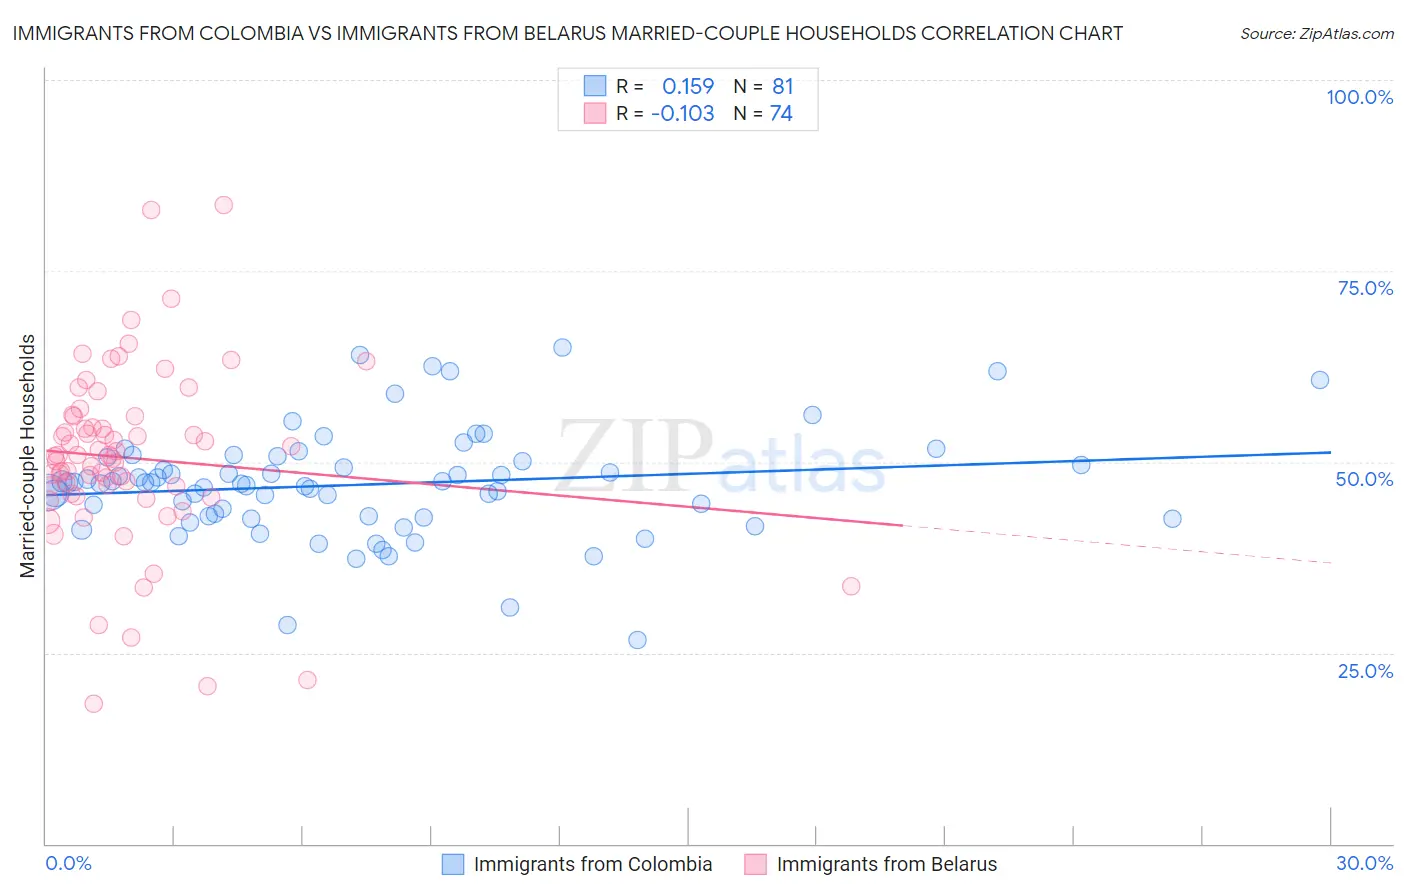
Immigrants from Colombia vs Immigrants from Belarus Married-couple Households Correlation Chart
The statistical analysis conducted on geographies consisting of 378,499,712 people shows a poor positive correlation between the proportion of Immigrants from Colombia and percentage of married-couple family households in the United States with a correlation coefficient (R) of 0.159 and weighted average of 46.4%. Similarly, the statistical analysis conducted on geographies consisting of 150,189,140 people shows a poor negative correlation between the proportion of Immigrants from Belarus and percentage of married-couple family households in the United States with a correlation coefficient (R) of -0.103 and weighted average of 47.2%, a difference of 1.7%.
Married-couple Households Correlation Summary
| Measurement | Immigrants from Colombia | Immigrants from Belarus |
| Minimum | 26.7% | 18.4% |
| Maximum | 64.9% | 83.7% |
| Range | 38.2% | 65.3% |
| Mean | 47.0% | 50.5% |
| Median | 47.3% | 50.8% |
| Interquartile 25% (IQ1) | 42.8% | 45.9% |
| Interquartile 75% (IQ3) | 50.4% | 55.9% |
| Interquartile Range (IQR) | 7.5% | 10.0% |
| Standard Deviation (Sample) | 7.1% | 11.7% |
| Standard Deviation (Population) | 7.1% | 11.6% |
Similar Demographics by Married-couple Households
Demographics Similar to Immigrants from Colombia by Married-couple Households
In terms of married-couple households, the demographic groups most similar to Immigrants from Colombia are Cajun (46.4%, a difference of 0.030%), Immigrants (46.3%, a difference of 0.090%), Immigrants from Costa Rica (46.3%, a difference of 0.10%), Immigrants from Zimbabwe (46.3%, a difference of 0.12%), and Immigrants from Mexico (46.4%, a difference of 0.15%).
| Demographics | Rating | Rank | Married-couple Households |
| Israelis | 62.3 /100 | #168 | Good 46.7% |
| Spanish American Indians | 59.4 /100 | #169 | Average 46.6% |
| South Americans | 58.0 /100 | #170 | Average 46.6% |
| Immigrants | Chile | 55.7 /100 | #171 | Average 46.5% |
| Immigrants | Australia | 54.6 /100 | #172 | Average 46.5% |
| Immigrants | Norway | 52.0 /100 | #173 | Average 46.5% |
| Immigrants | Mexico | 50.0 /100 | #174 | Average 46.4% |
| Immigrants | Colombia | 46.1 /100 | #175 | Average 46.4% |
| Cajuns | 45.2 /100 | #176 | Average 46.4% |
| Immigrants | Immigrants | 43.8 /100 | #177 | Average 46.3% |
| Immigrants | Costa Rica | 43.4 /100 | #178 | Average 46.3% |
| Immigrants | Zimbabwe | 43.0 /100 | #179 | Average 46.3% |
| Mongolians | 42.0 /100 | #180 | Average 46.3% |
| Malaysians | 41.8 /100 | #181 | Average 46.3% |
| Yugoslavians | 38.9 /100 | #182 | Fair 46.2% |
Demographics Similar to Immigrants from Belarus by Married-couple Households
In terms of married-couple households, the demographic groups most similar to Immigrants from Belarus are Spaniard (47.2%, a difference of 0.020%), Mexican (47.1%, a difference of 0.020%), Costa Rican (47.2%, a difference of 0.040%), Spanish (47.2%, a difference of 0.050%), and Immigrants from Sweden (47.2%, a difference of 0.060%).
| Demographics | Rating | Rank | Married-couple Households |
| New Zealanders | 85.3 /100 | #136 | Excellent 47.2% |
| Immigrants | Malaysia | 85.2 /100 | #137 | Excellent 47.2% |
| Immigrants | Afghanistan | 85.1 /100 | #138 | Excellent 47.2% |
| Immigrants | Sweden | 84.7 /100 | #139 | Excellent 47.2% |
| Spanish | 84.5 /100 | #140 | Excellent 47.2% |
| Costa Ricans | 84.4 /100 | #141 | Excellent 47.2% |
| Spaniards | 84.1 /100 | #142 | Excellent 47.2% |
| Immigrants | Belarus | 83.8 /100 | #143 | Excellent 47.2% |
| Mexicans | 83.4 /100 | #144 | Excellent 47.1% |
| Slovenes | 81.7 /100 | #145 | Excellent 47.1% |
| Immigrants | Western Europe | 81.6 /100 | #146 | Excellent 47.1% |
| Immigrants | Syria | 81.6 /100 | #147 | Excellent 47.1% |
| Icelanders | 79.5 /100 | #148 | Good 47.0% |
| Paraguayans | 78.7 /100 | #149 | Good 47.0% |
| Immigrants | Russia | 77.6 /100 | #150 | Good 47.0% |