German Russian vs Immigrants from Belarus Married-couple Households
COMPARE
German Russian
Immigrants from Belarus
Married-couple Households
Married-couple Households Comparison
German Russians
Immigrants from Belarus
44.0%
MARRIED-COUPLE HOUSEHOLDS
0.4/ 100
METRIC RATING
251st/ 347
METRIC RANK
47.2%
MARRIED-COUPLE HOUSEHOLDS
83.8/ 100
METRIC RATING
143rd/ 347
METRIC RANK
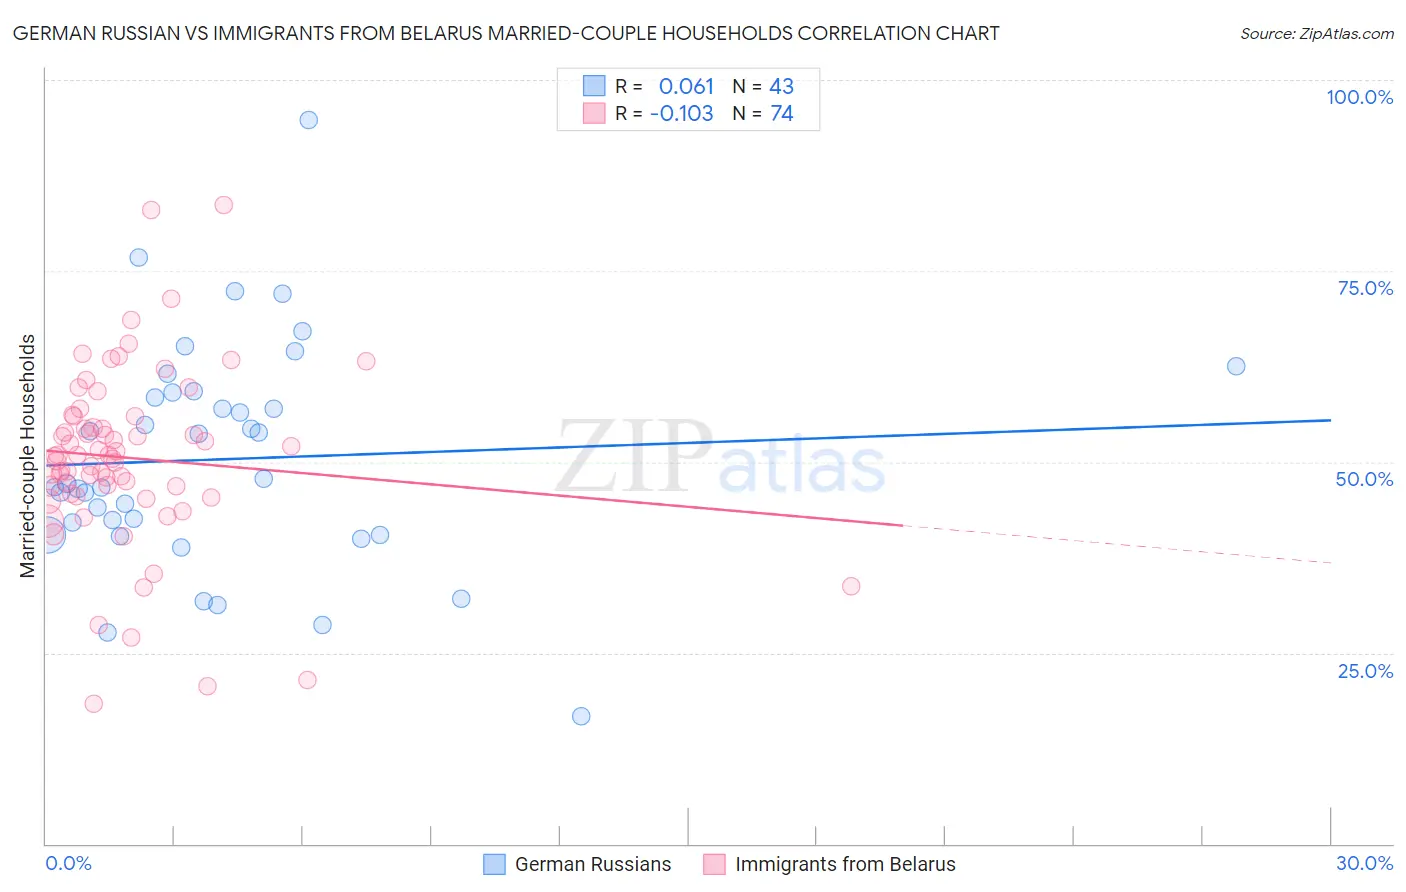
German Russian vs Immigrants from Belarus Married-couple Households Correlation Chart
The statistical analysis conducted on geographies consisting of 96,451,375 people shows a slight positive correlation between the proportion of German Russians and percentage of married-couple family households in the United States with a correlation coefficient (R) of 0.061 and weighted average of 44.0%. Similarly, the statistical analysis conducted on geographies consisting of 150,189,140 people shows a poor negative correlation between the proportion of Immigrants from Belarus and percentage of married-couple family households in the United States with a correlation coefficient (R) of -0.103 and weighted average of 47.2%, a difference of 7.1%.
Married-couple Households Correlation Summary
| Measurement | German Russian | Immigrants from Belarus |
| Minimum | 16.7% | 18.4% |
| Maximum | 94.7% | 83.7% |
| Range | 78.1% | 65.3% |
| Mean | 50.3% | 50.5% |
| Median | 47.1% | 50.8% |
| Interquartile 25% (IQ1) | 40.4% | 45.9% |
| Interquartile 75% (IQ3) | 59.0% | 55.9% |
| Interquartile Range (IQR) | 18.6% | 10.0% |
| Standard Deviation (Sample) | 14.7% | 11.7% |
| Standard Deviation (Population) | 14.5% | 11.6% |
Similar Demographics by Married-couple Households
Demographics Similar to German Russians by Married-couple Households
In terms of married-couple households, the demographic groups most similar to German Russians are Seminole (44.0%, a difference of 0.070%), French American Indian (44.1%, a difference of 0.080%), Immigrants from Kenya (44.1%, a difference of 0.090%), Yup'ik (44.1%, a difference of 0.14%), and Central American (43.9%, a difference of 0.19%).
| Demographics | Rating | Rank | Married-couple Households |
| Immigrants | Armenia | 0.7 /100 | #244 | Tragic 44.3% |
| Immigrants | El Salvador | 0.7 /100 | #245 | Tragic 44.3% |
| Immigrants | Cuba | 0.6 /100 | #246 | Tragic 44.2% |
| Immigrants | Morocco | 0.6 /100 | #247 | Tragic 44.2% |
| Yup'ik | 0.4 /100 | #248 | Tragic 44.1% |
| Immigrants | Kenya | 0.4 /100 | #249 | Tragic 44.1% |
| French American Indians | 0.4 /100 | #250 | Tragic 44.1% |
| German Russians | 0.4 /100 | #251 | Tragic 44.0% |
| Seminole | 0.4 /100 | #252 | Tragic 44.0% |
| Central Americans | 0.3 /100 | #253 | Tragic 43.9% |
| Apache | 0.3 /100 | #254 | Tragic 43.9% |
| Shoshone | 0.3 /100 | #255 | Tragic 43.9% |
| Ugandans | 0.3 /100 | #256 | Tragic 43.8% |
| Blackfeet | 0.2 /100 | #257 | Tragic 43.8% |
| Central American Indians | 0.2 /100 | #258 | Tragic 43.8% |
Demographics Similar to Immigrants from Belarus by Married-couple Households
In terms of married-couple households, the demographic groups most similar to Immigrants from Belarus are Spaniard (47.2%, a difference of 0.020%), Mexican (47.1%, a difference of 0.020%), Costa Rican (47.2%, a difference of 0.040%), Spanish (47.2%, a difference of 0.050%), and Immigrants from Sweden (47.2%, a difference of 0.060%).
| Demographics | Rating | Rank | Married-couple Households |
| New Zealanders | 85.3 /100 | #136 | Excellent 47.2% |
| Immigrants | Malaysia | 85.2 /100 | #137 | Excellent 47.2% |
| Immigrants | Afghanistan | 85.1 /100 | #138 | Excellent 47.2% |
| Immigrants | Sweden | 84.7 /100 | #139 | Excellent 47.2% |
| Spanish | 84.5 /100 | #140 | Excellent 47.2% |
| Costa Ricans | 84.4 /100 | #141 | Excellent 47.2% |
| Spaniards | 84.1 /100 | #142 | Excellent 47.2% |
| Immigrants | Belarus | 83.8 /100 | #143 | Excellent 47.2% |
| Mexicans | 83.4 /100 | #144 | Excellent 47.1% |
| Slovenes | 81.7 /100 | #145 | Excellent 47.1% |
| Immigrants | Western Europe | 81.6 /100 | #146 | Excellent 47.1% |
| Immigrants | Syria | 81.6 /100 | #147 | Excellent 47.1% |
| Icelanders | 79.5 /100 | #148 | Good 47.0% |
| Paraguayans | 78.7 /100 | #149 | Good 47.0% |
| Immigrants | Russia | 77.6 /100 | #150 | Good 47.0% |