Soviet Union vs Immigrants from Ethiopia Married-couple Households
COMPARE
Soviet Union
Immigrants from Ethiopia
Married-couple Households
Married-couple Households Comparison
Soviet Union
Immigrants from Ethiopia
44.6%
MARRIED-COUPLE HOUSEHOLDS
1.6/ 100
METRIC RATING
230th/ 347
METRIC RANK
43.1%
MARRIED-COUPLE HOUSEHOLDS
0.0/ 100
METRIC RATING
276th/ 347
METRIC RANK
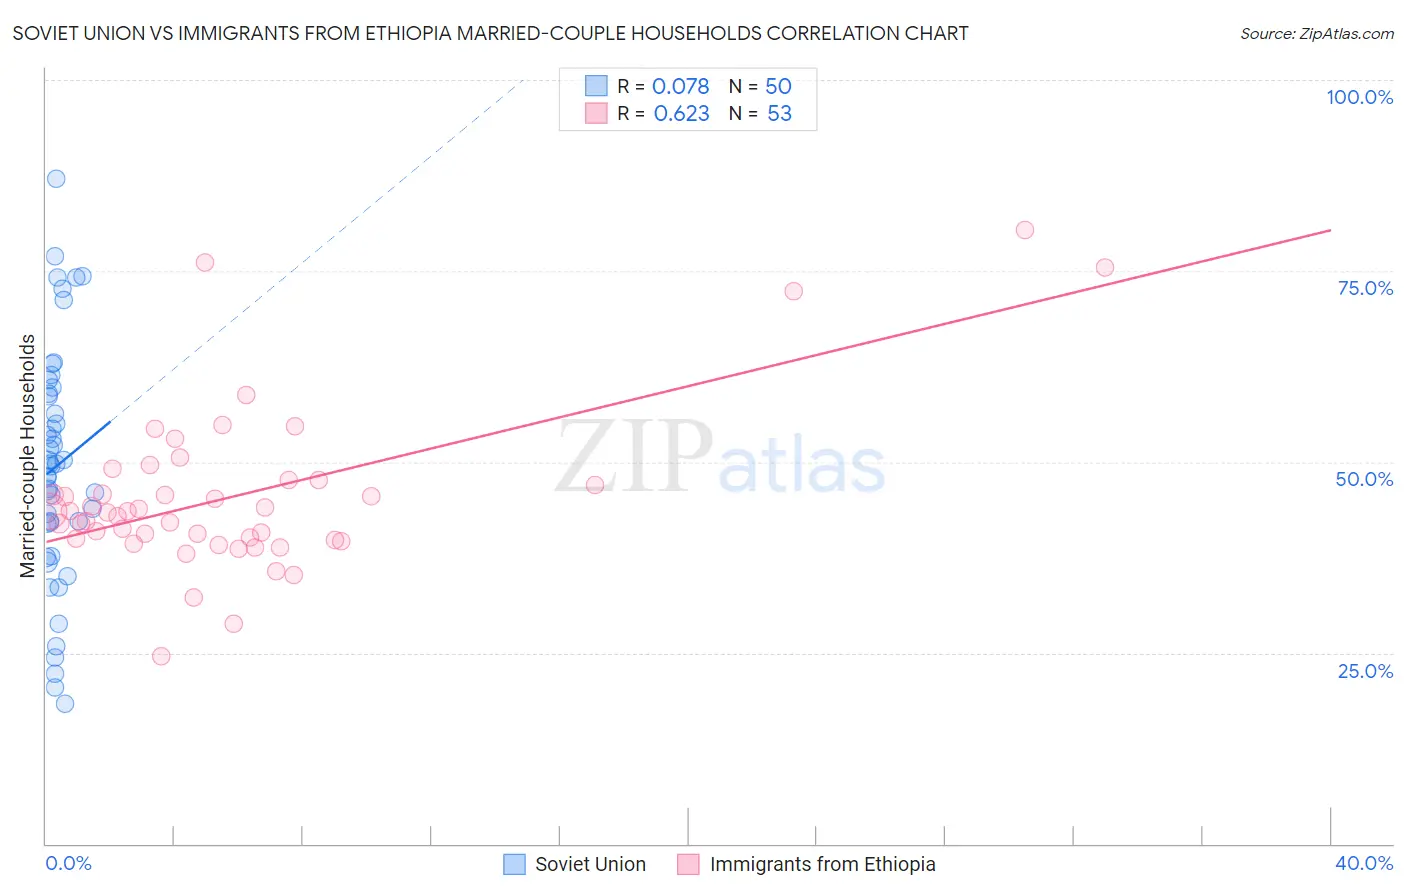
Soviet Union vs Immigrants from Ethiopia Married-couple Households Correlation Chart
The statistical analysis conducted on geographies consisting of 43,509,630 people shows a slight positive correlation between the proportion of Soviet Union and percentage of married-couple family households in the United States with a correlation coefficient (R) of 0.078 and weighted average of 44.6%. Similarly, the statistical analysis conducted on geographies consisting of 211,463,279 people shows a significant positive correlation between the proportion of Immigrants from Ethiopia and percentage of married-couple family households in the United States with a correlation coefficient (R) of 0.623 and weighted average of 43.1%, a difference of 3.7%.
Married-couple Households Correlation Summary
| Measurement | Soviet Union | Immigrants from Ethiopia |
| Minimum | 18.4% | 24.6% |
| Maximum | 87.0% | 80.4% |
| Range | 68.6% | 55.7% |
| Mean | 49.4% | 45.5% |
| Median | 49.6% | 43.5% |
| Interquartile 25% (IQ1) | 41.9% | 39.9% |
| Interquartile 75% (IQ3) | 58.9% | 47.7% |
| Interquartile Range (IQR) | 17.0% | 7.8% |
| Standard Deviation (Sample) | 15.5% | 10.7% |
| Standard Deviation (Population) | 15.3% | 10.6% |
Similar Demographics by Married-couple Households
Demographics Similar to Soviet Union by Married-couple Households
In terms of married-couple households, the demographic groups most similar to Soviet Union are Houma (44.6%, a difference of 0.010%), Marshallese (44.6%, a difference of 0.010%), Immigrants from Latin America (44.7%, a difference of 0.040%), Immigrants from Uganda (44.6%, a difference of 0.050%), and Kenyan (44.7%, a difference of 0.090%).
| Demographics | Rating | Rank | Married-couple Households |
| Immigrants | Cambodia | 2.7 /100 | #223 | Tragic 44.9% |
| Immigrants | Micronesia | 2.6 /100 | #224 | Tragic 44.9% |
| Dutch West Indians | 2.6 /100 | #225 | Tragic 44.9% |
| Alsatians | 2.3 /100 | #226 | Tragic 44.8% |
| Salvadorans | 1.9 /100 | #227 | Tragic 44.7% |
| Kenyans | 1.7 /100 | #228 | Tragic 44.7% |
| Immigrants | Latin America | 1.6 /100 | #229 | Tragic 44.7% |
| Soviet Union | 1.6 /100 | #230 | Tragic 44.6% |
| Houma | 1.5 /100 | #231 | Tragic 44.6% |
| Marshallese | 1.5 /100 | #232 | Tragic 44.6% |
| Immigrants | Uganda | 1.5 /100 | #233 | Tragic 44.6% |
| Immigrants | Panama | 1.3 /100 | #234 | Tragic 44.6% |
| Immigrants | Nicaragua | 1.2 /100 | #235 | Tragic 44.5% |
| Yaqui | 1.2 /100 | #236 | Tragic 44.5% |
| Comanche | 1.2 /100 | #237 | Tragic 44.5% |
Demographics Similar to Immigrants from Ethiopia by Married-couple Households
In terms of married-couple households, the demographic groups most similar to Immigrants from Ethiopia are Immigrants from Bangladesh (43.1%, a difference of 0.11%), Nigerian (43.2%, a difference of 0.25%), Ethiopian (43.2%, a difference of 0.26%), Immigrants from Eastern Africa (42.9%, a difference of 0.26%), and Immigrants from Nigeria (43.2%, a difference of 0.36%).
| Demographics | Rating | Rank | Married-couple Households |
| Immigrants | Sierra Leone | 0.1 /100 | #269 | Tragic 43.3% |
| Yuman | 0.1 /100 | #270 | Tragic 43.3% |
| Guatemalans | 0.1 /100 | #271 | Tragic 43.3% |
| Immigrants | Nigeria | 0.1 /100 | #272 | Tragic 43.2% |
| Ethiopians | 0.1 /100 | #273 | Tragic 43.2% |
| Nigerians | 0.1 /100 | #274 | Tragic 43.2% |
| Immigrants | Bangladesh | 0.0 /100 | #275 | Tragic 43.1% |
| Immigrants | Ethiopia | 0.0 /100 | #276 | Tragic 43.1% |
| Immigrants | Eastern Africa | 0.0 /100 | #277 | Tragic 42.9% |
| Immigrants | Africa | 0.0 /100 | #278 | Tragic 42.9% |
| Sierra Leoneans | 0.0 /100 | #279 | Tragic 42.9% |
| Immigrants | Ecuador | 0.0 /100 | #280 | Tragic 42.9% |
| Immigrants | Guatemala | 0.0 /100 | #281 | Tragic 42.8% |
| Bermudans | 0.0 /100 | #282 | Tragic 42.4% |
| Inupiat | 0.0 /100 | #283 | Tragic 42.4% |