Soviet Union vs Immigrants from Belgium Married-couple Households
COMPARE
Soviet Union
Immigrants from Belgium
Married-couple Households
Married-couple Households Comparison
Soviet Union
Immigrants from Belgium
44.6%
MARRIED-COUPLE HOUSEHOLDS
1.6/ 100
METRIC RATING
230th/ 347
METRIC RANK
47.9%
MARRIED-COUPLE HOUSEHOLDS
96.8/ 100
METRIC RATING
95th/ 347
METRIC RANK
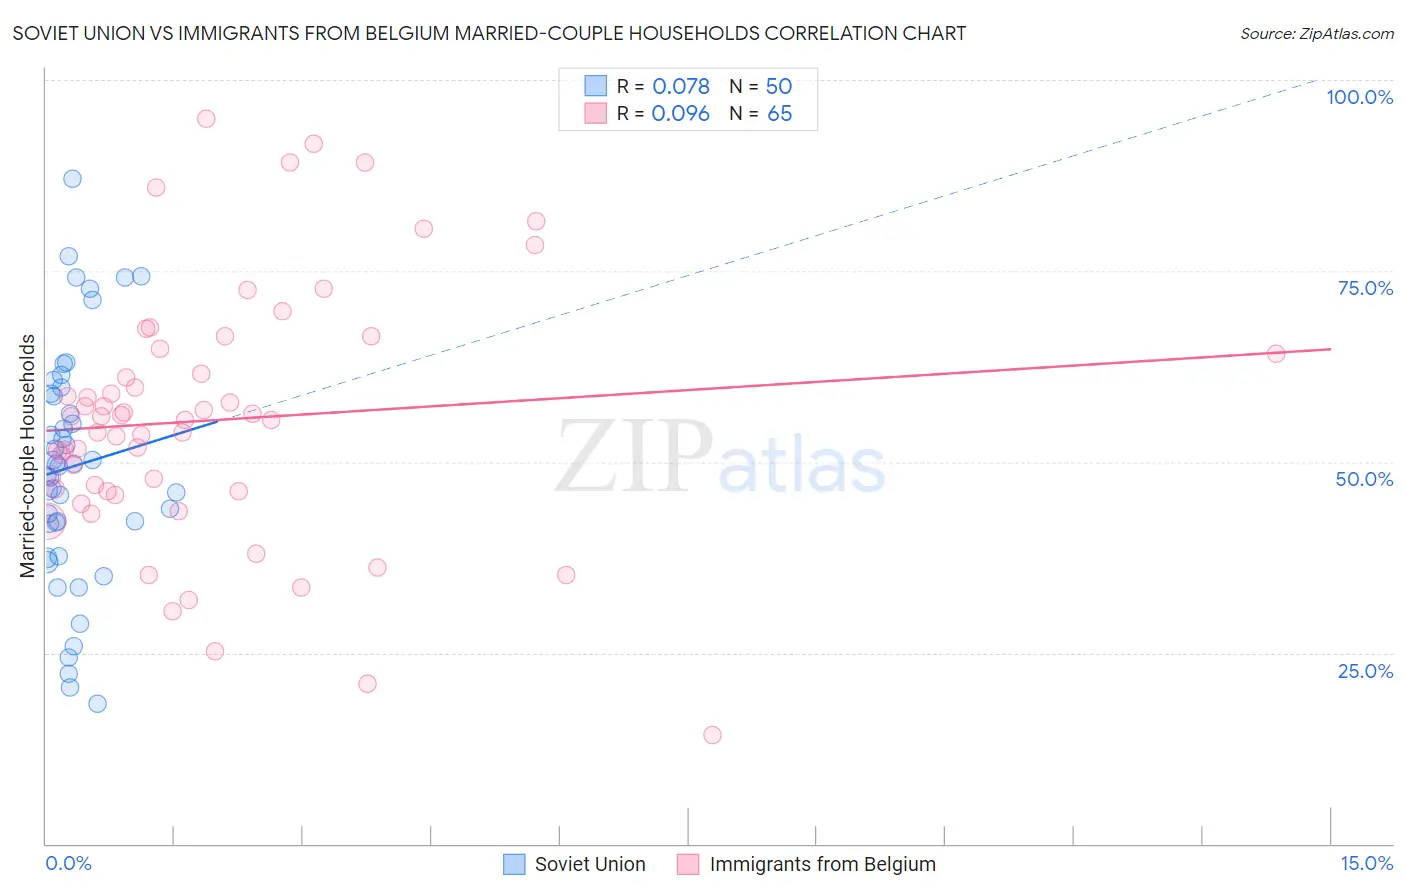
Soviet Union vs Immigrants from Belgium Married-couple Households Correlation Chart
The statistical analysis conducted on geographies consisting of 43,509,630 people shows a slight positive correlation between the proportion of Soviet Union and percentage of married-couple family households in the United States with a correlation coefficient (R) of 0.078 and weighted average of 44.6%. Similarly, the statistical analysis conducted on geographies consisting of 146,698,570 people shows a slight positive correlation between the proportion of Immigrants from Belgium and percentage of married-couple family households in the United States with a correlation coefficient (R) of 0.096 and weighted average of 47.9%, a difference of 7.4%.
Married-couple Households Correlation Summary
| Measurement | Soviet Union | Immigrants from Belgium |
| Minimum | 18.4% | 14.3% |
| Maximum | 87.0% | 94.9% |
| Range | 68.6% | 80.6% |
| Mean | 49.4% | 55.5% |
| Median | 49.6% | 55.5% |
| Interquartile 25% (IQ1) | 41.9% | 46.1% |
| Interquartile 75% (IQ3) | 58.9% | 64.5% |
| Interquartile Range (IQR) | 17.0% | 18.4% |
| Standard Deviation (Sample) | 15.5% | 16.6% |
| Standard Deviation (Population) | 15.3% | 16.5% |
Similar Demographics by Married-couple Households
Demographics Similar to Soviet Union by Married-couple Households
In terms of married-couple households, the demographic groups most similar to Soviet Union are Houma (44.6%, a difference of 0.010%), Marshallese (44.6%, a difference of 0.010%), Immigrants from Latin America (44.7%, a difference of 0.040%), Immigrants from Uganda (44.6%, a difference of 0.050%), and Kenyan (44.7%, a difference of 0.090%).
| Demographics | Rating | Rank | Married-couple Households |
| Immigrants | Cambodia | 2.7 /100 | #223 | Tragic 44.9% |
| Immigrants | Micronesia | 2.6 /100 | #224 | Tragic 44.9% |
| Dutch West Indians | 2.6 /100 | #225 | Tragic 44.9% |
| Alsatians | 2.3 /100 | #226 | Tragic 44.8% |
| Salvadorans | 1.9 /100 | #227 | Tragic 44.7% |
| Kenyans | 1.7 /100 | #228 | Tragic 44.7% |
| Immigrants | Latin America | 1.6 /100 | #229 | Tragic 44.7% |
| Soviet Union | 1.6 /100 | #230 | Tragic 44.6% |
| Houma | 1.5 /100 | #231 | Tragic 44.6% |
| Marshallese | 1.5 /100 | #232 | Tragic 44.6% |
| Immigrants | Uganda | 1.5 /100 | #233 | Tragic 44.6% |
| Immigrants | Panama | 1.3 /100 | #234 | Tragic 44.6% |
| Immigrants | Nicaragua | 1.2 /100 | #235 | Tragic 44.5% |
| Yaqui | 1.2 /100 | #236 | Tragic 44.5% |
| Comanche | 1.2 /100 | #237 | Tragic 44.5% |
Demographics Similar to Immigrants from Belgium by Married-couple Households
In terms of married-couple households, the demographic groups most similar to Immigrants from Belgium are American (47.9%, a difference of 0.030%), Lebanese (47.9%, a difference of 0.040%), Immigrants from Egypt (47.9%, a difference of 0.050%), Palestinian (48.0%, a difference of 0.060%), and Immigrants from Moldova (48.0%, a difference of 0.070%).
| Demographics | Rating | Rank | Married-couple Households |
| Afghans | 97.3 /100 | #88 | Exceptional 48.0% |
| Cypriots | 97.2 /100 | #89 | Exceptional 48.0% |
| French | 97.2 /100 | #90 | Exceptional 48.0% |
| Immigrants | Moldova | 97.0 /100 | #91 | Exceptional 48.0% |
| Palestinians | 96.9 /100 | #92 | Exceptional 48.0% |
| Lebanese | 96.9 /100 | #93 | Exceptional 47.9% |
| Americans | 96.9 /100 | #94 | Exceptional 47.9% |
| Immigrants | Belgium | 96.8 /100 | #95 | Exceptional 47.9% |
| Immigrants | Egypt | 96.6 /100 | #96 | Exceptional 47.9% |
| Latvians | 96.5 /100 | #97 | Exceptional 47.9% |
| Immigrants | North Macedonia | 96.4 /100 | #98 | Exceptional 47.9% |
| Immigrants | Austria | 96.4 /100 | #99 | Exceptional 47.9% |
| Immigrants | Italy | 96.3 /100 | #100 | Exceptional 47.9% |
| Turks | 96.1 /100 | #101 | Exceptional 47.8% |
| Slavs | 96.0 /100 | #102 | Exceptional 47.8% |