Scottish vs Bermudan Married-couple Households
COMPARE
Scottish
Bermudan
Married-couple Households
Married-couple Households Comparison
Scottish
Bermudans
49.0%
MARRIED-COUPLE HOUSEHOLDS
99.7/ 100
METRIC RATING
35th/ 347
METRIC RANK
42.4%
MARRIED-COUPLE HOUSEHOLDS
0.0/ 100
METRIC RATING
282nd/ 347
METRIC RANK
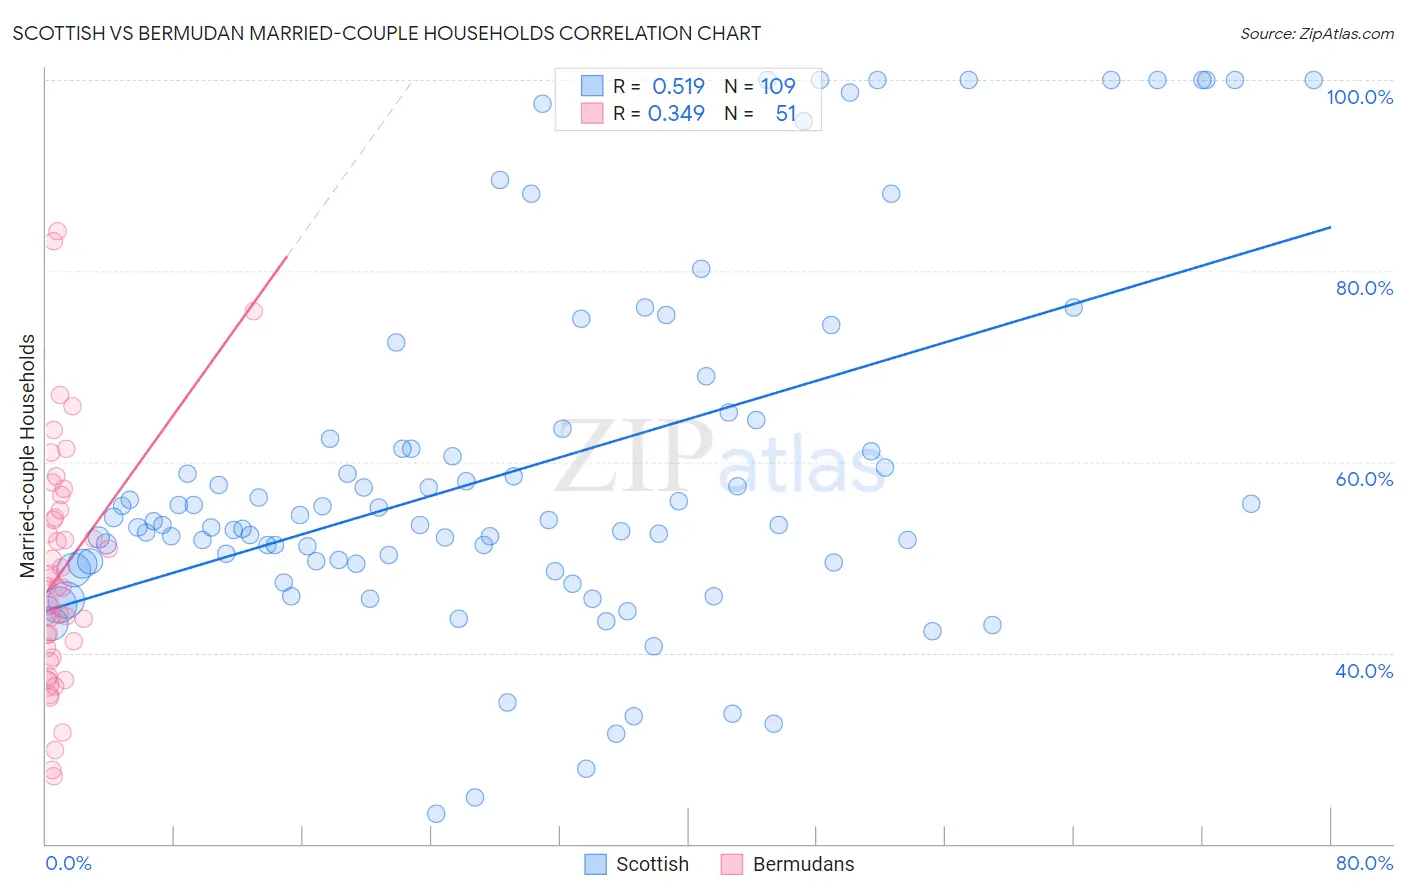
Scottish vs Bermudan Married-couple Households Correlation Chart
The statistical analysis conducted on geographies consisting of 566,528,942 people shows a substantial positive correlation between the proportion of Scottish and percentage of married-couple family households in the United States with a correlation coefficient (R) of 0.519 and weighted average of 49.0%. Similarly, the statistical analysis conducted on geographies consisting of 55,716,155 people shows a mild positive correlation between the proportion of Bermudans and percentage of married-couple family households in the United States with a correlation coefficient (R) of 0.349 and weighted average of 42.4%, a difference of 15.4%.
Married-couple Households Correlation Summary
| Measurement | Scottish | Bermudan |
| Minimum | 23.1% | 27.0% |
| Maximum | 100.0% | 84.2% |
| Range | 76.9% | 57.1% |
| Mean | 59.2% | 48.5% |
| Median | 53.4% | 46.9% |
| Interquartile 25% (IQ1) | 49.4% | 39.6% |
| Interquartile 75% (IQ3) | 62.9% | 55.0% |
| Interquartile Range (IQR) | 13.5% | 15.4% |
| Standard Deviation (Sample) | 18.8% | 12.6% |
| Standard Deviation (Population) | 18.7% | 12.5% |
Similar Demographics by Married-couple Households
Demographics Similar to Scottish by Married-couple Households
In terms of married-couple households, the demographic groups most similar to Scottish are Italian (49.0%, a difference of 0.020%), Iranian (49.0%, a difference of 0.090%), Sri Lankan (49.0%, a difference of 0.090%), Immigrants from Asia (49.1%, a difference of 0.10%), and Hungarian (49.1%, a difference of 0.13%).
| Demographics | Rating | Rank | Married-couple Households |
| Germans | 99.8 /100 | #28 | Exceptional 49.2% |
| Maltese | 99.8 /100 | #29 | Exceptional 49.2% |
| Bolivians | 99.8 /100 | #30 | Exceptional 49.2% |
| Native Hawaiians | 99.8 /100 | #31 | Exceptional 49.1% |
| Hungarians | 99.8 /100 | #32 | Exceptional 49.1% |
| Immigrants | Asia | 99.7 /100 | #33 | Exceptional 49.1% |
| Italians | 99.7 /100 | #34 | Exceptional 49.0% |
| Scottish | 99.7 /100 | #35 | Exceptional 49.0% |
| Iranians | 99.7 /100 | #36 | Exceptional 49.0% |
| Sri Lankans | 99.7 /100 | #37 | Exceptional 49.0% |
| Greeks | 99.7 /100 | #38 | Exceptional 48.9% |
| Lithuanians | 99.6 /100 | #39 | Exceptional 48.9% |
| Immigrants | Bolivia | 99.6 /100 | #40 | Exceptional 48.9% |
| Immigrants | Lebanon | 99.6 /100 | #41 | Exceptional 48.9% |
| Immigrants | Vietnam | 99.6 /100 | #42 | Exceptional 48.8% |
Demographics Similar to Bermudans by Married-couple Households
In terms of married-couple households, the demographic groups most similar to Bermudans are Inupiat (42.4%, a difference of 0.10%), Cheyenne (42.3%, a difference of 0.46%), Ghanaian (42.2%, a difference of 0.49%), Belizean (42.2%, a difference of 0.50%), and Chippewa (42.1%, a difference of 0.73%).
| Demographics | Rating | Rank | Married-couple Households |
| Immigrants | Bangladesh | 0.0 /100 | #275 | Tragic 43.1% |
| Immigrants | Ethiopia | 0.0 /100 | #276 | Tragic 43.1% |
| Immigrants | Eastern Africa | 0.0 /100 | #277 | Tragic 42.9% |
| Immigrants | Africa | 0.0 /100 | #278 | Tragic 42.9% |
| Sierra Leoneans | 0.0 /100 | #279 | Tragic 42.9% |
| Immigrants | Ecuador | 0.0 /100 | #280 | Tragic 42.9% |
| Immigrants | Guatemala | 0.0 /100 | #281 | Tragic 42.8% |
| Bermudans | 0.0 /100 | #282 | Tragic 42.4% |
| Inupiat | 0.0 /100 | #283 | Tragic 42.4% |
| Cheyenne | 0.0 /100 | #284 | Tragic 42.3% |
| Ghanaians | 0.0 /100 | #285 | Tragic 42.2% |
| Belizeans | 0.0 /100 | #286 | Tragic 42.2% |
| Chippewa | 0.0 /100 | #287 | Tragic 42.1% |
| Immigrants | Eritrea | 0.0 /100 | #288 | Tragic 42.1% |
| Sudanese | 0.0 /100 | #289 | Tragic 42.1% |