Yaqui vs Bermudan Married-couple Households
COMPARE
Yaqui
Bermudan
Married-couple Households
Married-couple Households Comparison
Yaqui
Bermudans
44.5%
MARRIED-COUPLE HOUSEHOLDS
1.2/ 100
METRIC RATING
236th/ 347
METRIC RANK
42.4%
MARRIED-COUPLE HOUSEHOLDS
0.0/ 100
METRIC RATING
282nd/ 347
METRIC RANK
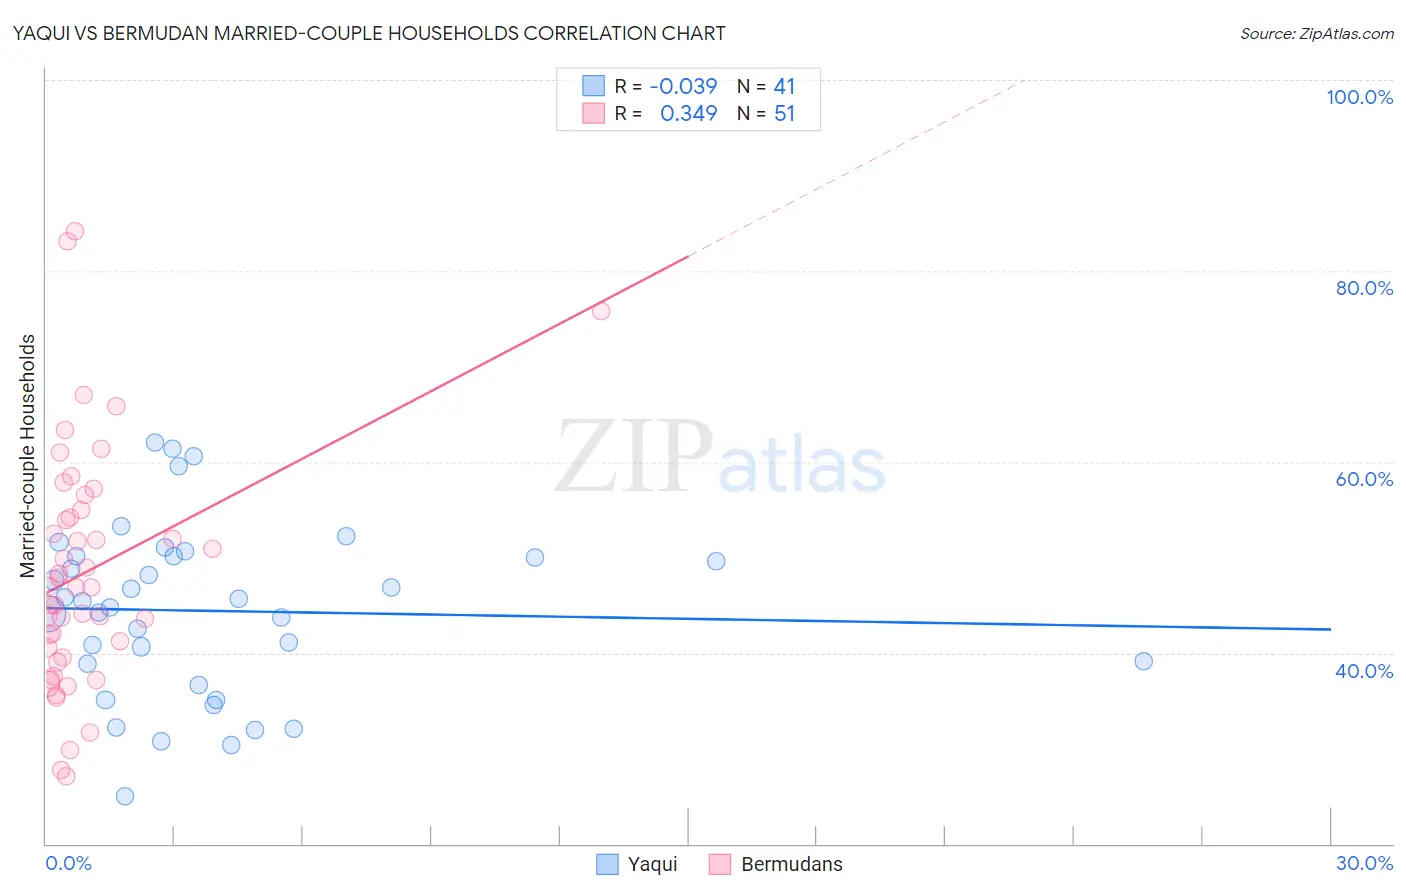
Yaqui vs Bermudan Married-couple Households Correlation Chart
The statistical analysis conducted on geographies consisting of 107,720,236 people shows no correlation between the proportion of Yaqui and percentage of married-couple family households in the United States with a correlation coefficient (R) of -0.039 and weighted average of 44.5%. Similarly, the statistical analysis conducted on geographies consisting of 55,716,155 people shows a mild positive correlation between the proportion of Bermudans and percentage of married-couple family households in the United States with a correlation coefficient (R) of 0.349 and weighted average of 42.4%, a difference of 4.9%.
Married-couple Households Correlation Summary
| Measurement | Yaqui | Bermudan |
| Minimum | 25.0% | 27.0% |
| Maximum | 62.1% | 84.2% |
| Range | 37.1% | 57.1% |
| Mean | 44.4% | 48.5% |
| Median | 45.4% | 46.9% |
| Interquartile 25% (IQ1) | 37.8% | 39.6% |
| Interquartile 75% (IQ3) | 50.2% | 55.0% |
| Interquartile Range (IQR) | 12.4% | 15.4% |
| Standard Deviation (Sample) | 9.0% | 12.6% |
| Standard Deviation (Population) | 8.9% | 12.5% |
Similar Demographics by Married-couple Households
Demographics Similar to Yaqui by Married-couple Households
In terms of married-couple households, the demographic groups most similar to Yaqui are Immigrants from Nicaragua (44.5%, a difference of 0.0%), Comanche (44.5%, a difference of 0.030%), Immigrants from Panama (44.6%, a difference of 0.080%), Immigrants from Uruguay (44.5%, a difference of 0.080%), and Spanish American (44.5%, a difference of 0.10%).
| Demographics | Rating | Rank | Married-couple Households |
| Immigrants | Latin America | 1.6 /100 | #229 | Tragic 44.7% |
| Soviet Union | 1.6 /100 | #230 | Tragic 44.6% |
| Houma | 1.5 /100 | #231 | Tragic 44.6% |
| Marshallese | 1.5 /100 | #232 | Tragic 44.6% |
| Immigrants | Uganda | 1.5 /100 | #233 | Tragic 44.6% |
| Immigrants | Panama | 1.3 /100 | #234 | Tragic 44.6% |
| Immigrants | Nicaragua | 1.2 /100 | #235 | Tragic 44.5% |
| Yaqui | 1.2 /100 | #236 | Tragic 44.5% |
| Comanche | 1.2 /100 | #237 | Tragic 44.5% |
| Immigrants | Uruguay | 1.1 /100 | #238 | Tragic 44.5% |
| Spanish Americans | 1.1 /100 | #239 | Tragic 44.5% |
| Ute | 1.0 /100 | #240 | Tragic 44.4% |
| Immigrants | Bosnia and Herzegovina | 1.0 /100 | #241 | Tragic 44.4% |
| Immigrants | Albania | 1.0 /100 | #242 | Tragic 44.4% |
| Immigrants | Saudi Arabia | 0.9 /100 | #243 | Tragic 44.4% |
Demographics Similar to Bermudans by Married-couple Households
In terms of married-couple households, the demographic groups most similar to Bermudans are Inupiat (42.4%, a difference of 0.10%), Cheyenne (42.3%, a difference of 0.46%), Ghanaian (42.2%, a difference of 0.49%), Belizean (42.2%, a difference of 0.50%), and Chippewa (42.1%, a difference of 0.73%).
| Demographics | Rating | Rank | Married-couple Households |
| Immigrants | Bangladesh | 0.0 /100 | #275 | Tragic 43.1% |
| Immigrants | Ethiopia | 0.0 /100 | #276 | Tragic 43.1% |
| Immigrants | Eastern Africa | 0.0 /100 | #277 | Tragic 42.9% |
| Immigrants | Africa | 0.0 /100 | #278 | Tragic 42.9% |
| Sierra Leoneans | 0.0 /100 | #279 | Tragic 42.9% |
| Immigrants | Ecuador | 0.0 /100 | #280 | Tragic 42.9% |
| Immigrants | Guatemala | 0.0 /100 | #281 | Tragic 42.8% |
| Bermudans | 0.0 /100 | #282 | Tragic 42.4% |
| Inupiat | 0.0 /100 | #283 | Tragic 42.4% |
| Cheyenne | 0.0 /100 | #284 | Tragic 42.3% |
| Ghanaians | 0.0 /100 | #285 | Tragic 42.2% |
| Belizeans | 0.0 /100 | #286 | Tragic 42.2% |
| Chippewa | 0.0 /100 | #287 | Tragic 42.1% |
| Immigrants | Eritrea | 0.0 /100 | #288 | Tragic 42.1% |
| Sudanese | 0.0 /100 | #289 | Tragic 42.1% |