Cuban vs Bermudan Married-couple Households
COMPARE
Cuban
Bermudan
Married-couple Households
Married-couple Households Comparison
Cubans
Bermudans
45.4%
MARRIED-COUPLE HOUSEHOLDS
7.7/ 100
METRIC RATING
210th/ 347
METRIC RANK
42.4%
MARRIED-COUPLE HOUSEHOLDS
0.0/ 100
METRIC RATING
282nd/ 347
METRIC RANK
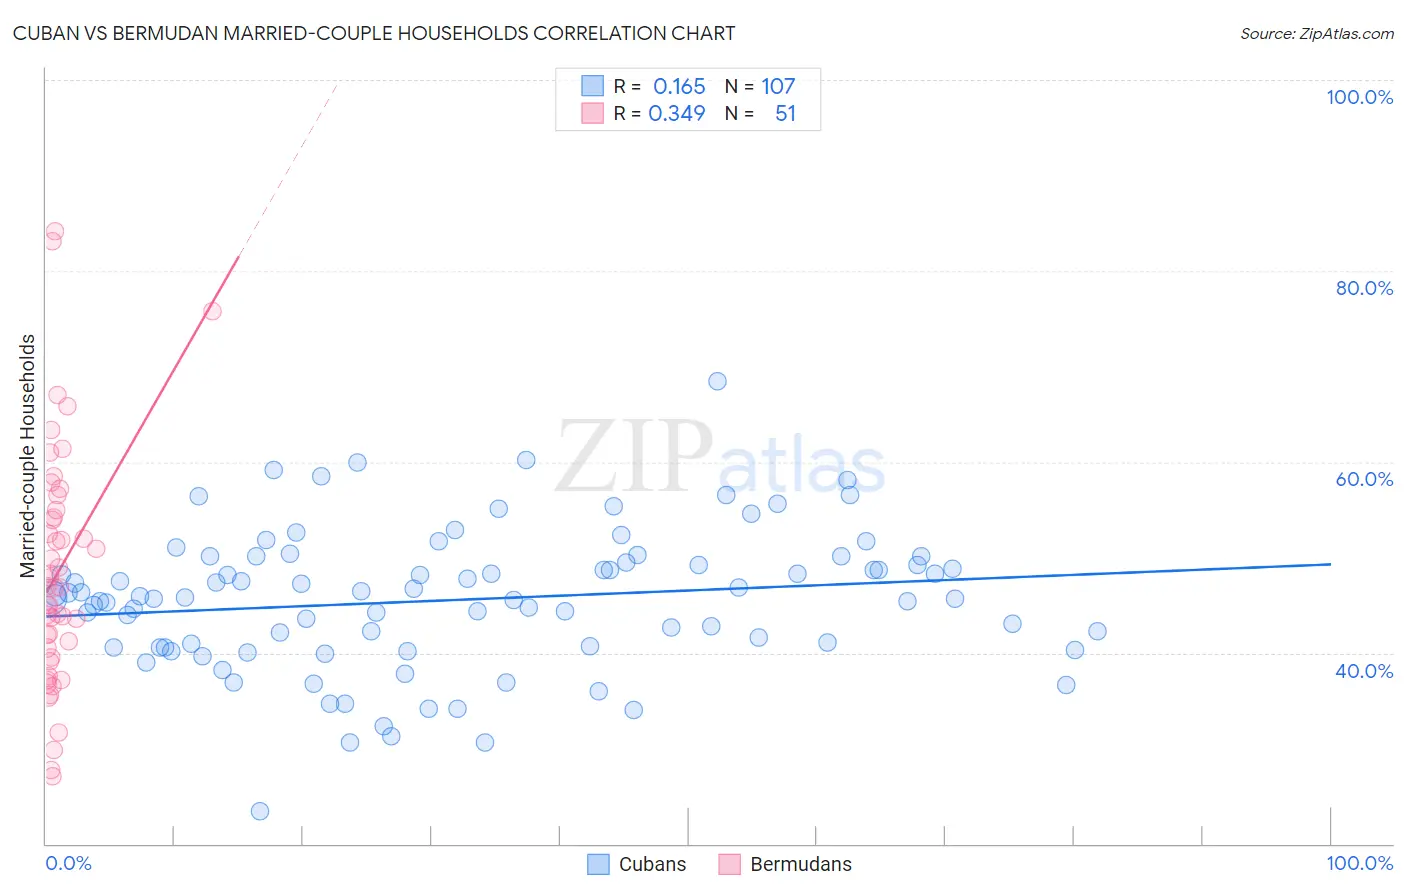
Cuban vs Bermudan Married-couple Households Correlation Chart
The statistical analysis conducted on geographies consisting of 448,946,522 people shows a poor positive correlation between the proportion of Cubans and percentage of married-couple family households in the United States with a correlation coefficient (R) of 0.165 and weighted average of 45.4%. Similarly, the statistical analysis conducted on geographies consisting of 55,716,155 people shows a mild positive correlation between the proportion of Bermudans and percentage of married-couple family households in the United States with a correlation coefficient (R) of 0.349 and weighted average of 42.4%, a difference of 6.9%.
Married-couple Households Correlation Summary
| Measurement | Cuban | Bermudan |
| Minimum | 23.5% | 27.0% |
| Maximum | 68.4% | 84.2% |
| Range | 45.0% | 57.1% |
| Mean | 45.5% | 48.5% |
| Median | 45.8% | 46.9% |
| Interquartile 25% (IQ1) | 40.6% | 39.6% |
| Interquartile 75% (IQ3) | 49.4% | 55.0% |
| Interquartile Range (IQR) | 8.8% | 15.4% |
| Standard Deviation (Sample) | 7.3% | 12.6% |
| Standard Deviation (Population) | 7.3% | 12.5% |
Similar Demographics by Married-couple Households
Demographics Similar to Cubans by Married-couple Households
In terms of married-couple households, the demographic groups most similar to Cubans are Immigrants from Spain (45.3%, a difference of 0.050%), Immigrants from Uzbekistan (45.4%, a difference of 0.090%), Hispanic or Latino (45.4%, a difference of 0.13%), Immigrants from France (45.4%, a difference of 0.14%), and Creek (45.3%, a difference of 0.18%).
| Demographics | Rating | Rank | Married-couple Households |
| Alaska Natives | 13.0 /100 | #203 | Poor 45.6% |
| Aleuts | 12.5 /100 | #204 | Poor 45.6% |
| Nepalese | 11.9 /100 | #205 | Poor 45.6% |
| Uruguayans | 10.4 /100 | #206 | Poor 45.5% |
| Immigrants | France | 8.8 /100 | #207 | Tragic 45.4% |
| Hispanics or Latinos | 8.7 /100 | #208 | Tragic 45.4% |
| Immigrants | Uzbekistan | 8.4 /100 | #209 | Tragic 45.4% |
| Cubans | 7.7 /100 | #210 | Tragic 45.4% |
| Immigrants | Spain | 7.3 /100 | #211 | Tragic 45.3% |
| Creek | 6.4 /100 | #212 | Tragic 45.3% |
| Yakama | 5.8 /100 | #213 | Tragic 45.2% |
| Japanese | 5.7 /100 | #214 | Tragic 45.2% |
| Immigrants | Nepal | 5.6 /100 | #215 | Tragic 45.2% |
| Immigrants | Portugal | 5.6 /100 | #216 | Tragic 45.2% |
| Panamanians | 5.5 /100 | #217 | Tragic 45.2% |
Demographics Similar to Bermudans by Married-couple Households
In terms of married-couple households, the demographic groups most similar to Bermudans are Inupiat (42.4%, a difference of 0.10%), Cheyenne (42.3%, a difference of 0.46%), Ghanaian (42.2%, a difference of 0.49%), Belizean (42.2%, a difference of 0.50%), and Chippewa (42.1%, a difference of 0.73%).
| Demographics | Rating | Rank | Married-couple Households |
| Immigrants | Bangladesh | 0.0 /100 | #275 | Tragic 43.1% |
| Immigrants | Ethiopia | 0.0 /100 | #276 | Tragic 43.1% |
| Immigrants | Eastern Africa | 0.0 /100 | #277 | Tragic 42.9% |
| Immigrants | Africa | 0.0 /100 | #278 | Tragic 42.9% |
| Sierra Leoneans | 0.0 /100 | #279 | Tragic 42.9% |
| Immigrants | Ecuador | 0.0 /100 | #280 | Tragic 42.9% |
| Immigrants | Guatemala | 0.0 /100 | #281 | Tragic 42.8% |
| Bermudans | 0.0 /100 | #282 | Tragic 42.4% |
| Inupiat | 0.0 /100 | #283 | Tragic 42.4% |
| Cheyenne | 0.0 /100 | #284 | Tragic 42.3% |
| Ghanaians | 0.0 /100 | #285 | Tragic 42.2% |
| Belizeans | 0.0 /100 | #286 | Tragic 42.2% |
| Chippewa | 0.0 /100 | #287 | Tragic 42.1% |
| Immigrants | Eritrea | 0.0 /100 | #288 | Tragic 42.1% |
| Sudanese | 0.0 /100 | #289 | Tragic 42.1% |