Paiute vs Immigrants from Taiwan Family Households
COMPARE
Paiute
Immigrants from Taiwan
Family Households
Family Households Comparison
Paiute
Immigrants from Taiwan
64.0%
FAMILY HOUSEHOLDS
22.2/ 100
METRIC RATING
194th/ 347
METRIC RANK
68.0%
FAMILY HOUSEHOLDS
100.0/ 100
METRIC RATING
18th/ 347
METRIC RANK
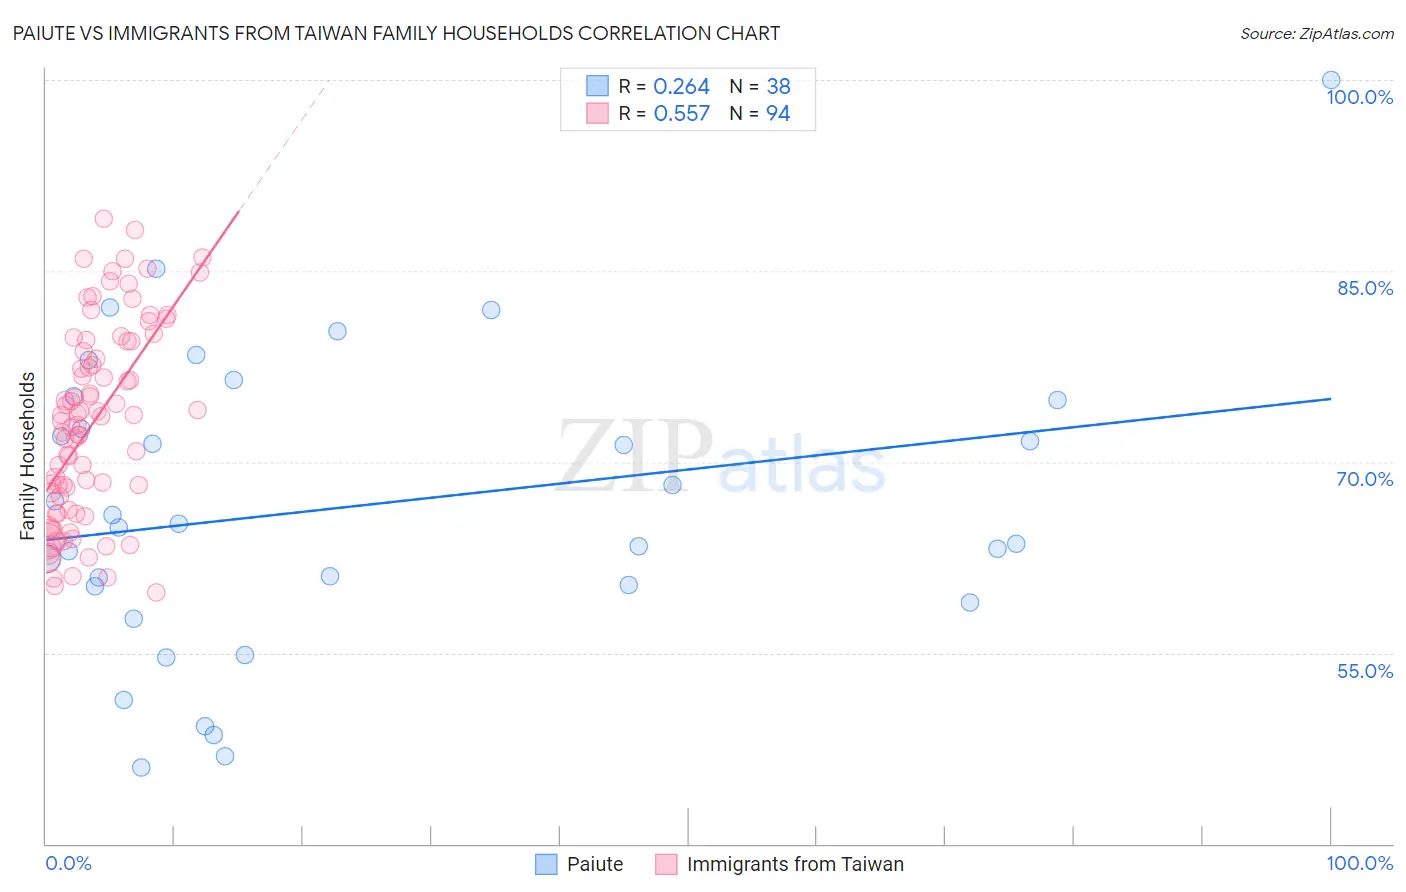
Paiute vs Immigrants from Taiwan Family Households Correlation Chart
The statistical analysis conducted on geographies consisting of 58,392,138 people shows a weak positive correlation between the proportion of Paiute and percentage of family households in the United States with a correlation coefficient (R) of 0.264 and weighted average of 64.0%. Similarly, the statistical analysis conducted on geographies consisting of 298,121,078 people shows a substantial positive correlation between the proportion of Immigrants from Taiwan and percentage of family households in the United States with a correlation coefficient (R) of 0.557 and weighted average of 68.0%, a difference of 6.2%.
Family Households Correlation Summary
| Measurement | Paiute | Immigrants from Taiwan |
| Minimum | 46.0% | 59.8% |
| Maximum | 100.0% | 89.1% |
| Range | 54.0% | 29.3% |
| Mean | 66.5% | 73.0% |
| Median | 65.0% | 73.4% |
| Interquartile 25% (IQ1) | 60.2% | 66.3% |
| Interquartile 75% (IQ3) | 74.8% | 79.4% |
| Interquartile Range (IQR) | 14.6% | 13.2% |
| Standard Deviation (Sample) | 11.7% | 7.6% |
| Standard Deviation (Population) | 11.6% | 7.5% |
Similar Demographics by Family Households
Demographics Similar to Paiute by Family Households
In terms of family households, the demographic groups most similar to Paiute are Lithuanian (64.0%, a difference of 0.030%), French (64.0%, a difference of 0.030%), Arab (64.1%, a difference of 0.040%), Immigrants from North America (64.0%, a difference of 0.040%), and Zimbabwean (64.1%, a difference of 0.050%).
| Demographics | Rating | Rank | Family Households |
| Northern Europeans | 28.2 /100 | #187 | Fair 64.1% |
| Paraguayans | 26.7 /100 | #188 | Fair 64.1% |
| Immigrants | Western Asia | 25.3 /100 | #189 | Fair 64.1% |
| Zimbabweans | 24.7 /100 | #190 | Fair 64.1% |
| Arabs | 24.5 /100 | #191 | Fair 64.1% |
| Lithuanians | 23.8 /100 | #192 | Fair 64.0% |
| French | 23.7 /100 | #193 | Fair 64.0% |
| Paiute | 22.2 /100 | #194 | Fair 64.0% |
| Immigrants | North America | 20.0 /100 | #195 | Poor 64.0% |
| Immigrants | Canada | 19.2 /100 | #196 | Poor 64.0% |
| Seminole | 18.9 /100 | #197 | Poor 64.0% |
| Poles | 18.9 /100 | #198 | Poor 64.0% |
| Slavs | 18.6 /100 | #199 | Poor 64.0% |
| Immigrants | Malaysia | 17.9 /100 | #200 | Poor 64.0% |
| Immigrants | Eastern Europe | 17.2 /100 | #201 | Poor 64.0% |
Demographics Similar to Immigrants from Taiwan by Family Households
In terms of family households, the demographic groups most similar to Immigrants from Taiwan are Samoan (67.9%, a difference of 0.12%), Chinese (68.1%, a difference of 0.16%), Immigrants from Vietnam (68.2%, a difference of 0.19%), Assyrian/Chaldean/Syriac (68.2%, a difference of 0.20%), and Pueblo (68.2%, a difference of 0.26%).
| Demographics | Rating | Rank | Family Households |
| Immigrants | Central America | 100.0 /100 | #11 | Exceptional 68.3% |
| Koreans | 100.0 /100 | #12 | Exceptional 68.3% |
| Pueblo | 100.0 /100 | #13 | Exceptional 68.2% |
| Immigrants | Cuba | 100.0 /100 | #14 | Exceptional 68.2% |
| Assyrians/Chaldeans/Syriacs | 100.0 /100 | #15 | Exceptional 68.2% |
| Immigrants | Vietnam | 100.0 /100 | #16 | Exceptional 68.2% |
| Chinese | 100.0 /100 | #17 | Exceptional 68.1% |
| Immigrants | Taiwan | 100.0 /100 | #18 | Exceptional 68.0% |
| Samoans | 100.0 /100 | #19 | Exceptional 67.9% |
| Inupiat | 100.0 /100 | #20 | Exceptional 67.8% |
| Cubans | 100.0 /100 | #21 | Exceptional 67.7% |
| Sri Lankans | 100.0 /100 | #22 | Exceptional 67.7% |
| Immigrants | Pakistan | 100.0 /100 | #23 | Exceptional 67.7% |
| Immigrants | South Eastern Asia | 100.0 /100 | #24 | Exceptional 67.5% |
| Immigrants | Nicaragua | 100.0 /100 | #25 | Exceptional 67.5% |