Immigrants from Hong Kong vs Immigrants from Taiwan Family Households

COMPARE

Immigrants from Hong Kong
Race
Ancestry
AfghanAfricanAlaska NativeAlaskan AthabascanAlbanianAleutAlsatianAmericanApacheArabArapahoArgentineanArmenianAssyrian/Chaldean/SyriacAustralianAustrianBahamianBangladeshiBarbadianBasqueBelgianBelizeanBermudanBhutaneseBlackfeetBolivianBrazilianBritishBritish West IndianBulgarianBurmeseCajunCambodianCanadianCape VerdeanCarpatho RusynCelticCentral AmericanCentral American IndianCherokeeCheyenneChickasawChileanChineseChippewaChoctawColombianColvilleComancheCosta RicanCreeCreekCroatianCrowCubanCypriotCzechCzechoslovakianDanishDelawareDominicanDutchDutch West IndianEastern EuropeanEcuadorianEgyptianEnglishEstonianEthiopianEuropeanFijianFilipinoFinnishFrenchFrench American IndianFrench CanadianGermanGerman RussianGhanaianGreekGuamanian/ChamorroGuatemalanGuyaneseHaitianHmongHonduranHopiHoumaHungarianIcelanderIndian (Asian)IndonesianInupiatIranianIraqiIrishIroquoisIsraeliItalianJamaicanJapaneseJordanianKenyanKiowaKoreanLaotianLatvianLebaneseLiberianLithuanianLumbeeLuxembourgerMacedonianMalaysianMalteseMarshalleseMenomineeMexicanMexican American IndianMongolianMoroccanNative HawaiianNavajoNepaleseNew ZealanderNicaraguanNigerianNorthern EuropeanNorwegianOkinawanOsageOttawaPaiutePakistaniPalestinianPanamanianParaguayanPennsylvania GermanPeruvianPimaPolishPortuguesePotawatomiPuebloPuerto RicanPuget Sound SalishRomanianRussianSalvadoranSamoanScandinavianScotch-IrishScottishSeminoleSenegaleseSerbianShoshoneSierra LeoneanSiouxSlavicSlovakSloveneSomaliSouth AfricanSouth AmericanSouth American IndianSoviet UnionSpaniardSpanishSpanish AmericanSpanish American IndianSri LankanSubsaharan AfricanSudaneseSwedishSwissSyrianTaiwaneseThaiTlingit-HaidaTohono O'OdhamTonganTrinidadian and TobagonianTsimshianTurkishU.S. Virgin IslanderUgandanUkrainianUruguayanUteVenezuelanVietnameseWelshWest IndianYakamaYaquiYugoslavianYumanYup'ikZimbabwean
Immigration
NonimmigrantsImmigrantsAfghanistanAfricaAlbaniaArgentinaArmeniaAsiaAustraliaAustriaBahamasBangladeshBarbadosBelarusBelgiumBelizeBoliviaBosnia and HerzegovinaBrazilBulgariaBurma/MyanmarCabo VerdeCambodiaCameroonCanadaCaribbeanCentral AmericaChileChinaColombiaCongoCosta RicaCroatiaCubaCzechoslovakiaDenmarkDominicaDominican RepublicEastern AfricaEastern AsiaEastern EuropeEcuadorEgyptEl SalvadorEnglandEritreaEthiopiaEuropeFijiFranceGermanyGhanaGreeceGrenadaGuatemalaGuyanaHaitiHondurasHong KongHungaryIndiaIndonesiaIranIraqIrelandIsraelItalyJamaicaJapanJordanKazakhstanKenyaKoreaKuwaitLaosLatin AmericaLatviaLebanonLiberiaLithuaniaMalaysiaMexicoMicronesiaMiddle AfricaMoldovaMoroccoNepalNetherlandsNicaraguaNigeriaNorth AmericaNorth MacedoniaNorthern AfricaNorthern EuropeNorwayOceaniaPakistanPanamaPeruPhilippinesPolandPortugalRomaniaRussiaSaudi ArabiaScotlandSenegalSerbiaSierra LeoneSingaporeSomaliaSouth AfricaSouth AmericaSouth Central AsiaSouth Eastern AsiaSouthern EuropeSpainSri LankaSt. Vincent and the GrenadinesSudanSwedenSwitzerlandSyriaThailandTrinidad and TobagoTurkeyUgandaUkraineUruguayUzbekistanVenezuelaVietnamWest IndiesWestern AfricaWestern AsiaWestern EuropeYemenZaireZimbabweAzores
Immigrants from Taiwan
Race
Ancestry
AfghanAfricanAlaska NativeAlaskan AthabascanAlbanianAleutAlsatianAmericanApacheArabArapahoArgentineanArmenianAssyrian/Chaldean/SyriacAustralianAustrianBahamianBangladeshiBarbadianBasqueBelgianBelizeanBermudanBhutaneseBlackfeetBolivianBrazilianBritishBritish West IndianBulgarianBurmeseCajunCambodianCanadianCape VerdeanCarpatho RusynCelticCentral AmericanCentral American IndianCherokeeCheyenneChickasawChileanChineseChippewaChoctawColombianColvilleComancheCosta RicanCreeCreekCroatianCrowCubanCypriotCzechCzechoslovakianDanishDelawareDominicanDutchDutch West IndianEastern EuropeanEcuadorianEgyptianEnglishEstonianEthiopianEuropeanFijianFilipinoFinnishFrenchFrench American IndianFrench CanadianGermanGerman RussianGhanaianGreekGuamanian/ChamorroGuatemalanGuyaneseHaitianHmongHonduranHopiHoumaHungarianIcelanderIndian (Asian)IndonesianInupiatIranianIraqiIrishIroquoisIsraeliItalianJamaicanJapaneseJordanianKenyanKiowaKoreanLaotianLatvianLebaneseLiberianLithuanianLumbeeLuxembourgerMacedonianMalaysianMalteseMarshalleseMenomineeMexicanMexican American IndianMongolianMoroccanNative HawaiianNavajoNepaleseNew ZealanderNicaraguanNigerianNorthern EuropeanNorwegianOkinawanOsageOttawaPaiutePakistaniPalestinianPanamanianParaguayanPennsylvania GermanPeruvianPimaPolishPortuguesePotawatomiPuebloPuerto RicanPuget Sound SalishRomanianRussianSalvadoranSamoanScandinavianScotch-IrishScottishSeminoleSenegaleseSerbianShoshoneSierra LeoneanSiouxSlavicSlovakSloveneSomaliSouth AfricanSouth AmericanSouth American IndianSoviet UnionSpaniardSpanishSpanish AmericanSpanish American IndianSri LankanSubsaharan AfricanSudaneseSwedishSwissSyrianTaiwaneseThaiTlingit-HaidaTohono O'OdhamTonganTrinidadian and TobagonianTsimshianTurkishU.S. Virgin IslanderUgandanUkrainianUruguayanUteVenezuelanVietnameseWelshWest IndianYakamaYaquiYugoslavianYumanYup'ikZimbabwean
Immigration
NonimmigrantsImmigrantsAfghanistanAfricaAlbaniaArgentinaArmeniaAsiaAustraliaAustriaBahamasBangladeshBarbadosBelarusBelgiumBelizeBoliviaBosnia and HerzegovinaBrazilBulgariaBurma/MyanmarCabo VerdeCambodiaCameroonCanadaCaribbeanCentral AmericaChileChinaColombiaCongoCosta RicaCroatiaCubaCzechoslovakiaDenmarkDominicaDominican RepublicEastern AfricaEastern AsiaEastern EuropeEcuadorEgyptEl SalvadorEnglandEritreaEthiopiaEuropeFijiFranceGermanyGhanaGreeceGrenadaGuatemalaGuyanaHaitiHondurasHungaryIndiaIndonesiaIranIraqIrelandIsraelItalyJamaicaJapanJordanKazakhstanKenyaKoreaKuwaitLaosLatin AmericaLatviaLebanonLiberiaLithuaniaMalaysiaMexicoMicronesiaMiddle AfricaMoldovaMoroccoNepalNetherlandsNicaraguaNigeriaNorth AmericaNorth MacedoniaNorthern AfricaNorthern EuropeNorwayOceaniaPakistanPanamaPeruPhilippinesPolandPortugalRomaniaRussiaSaudi ArabiaScotlandSenegalSerbiaSierra LeoneSingaporeSomaliaSouth AfricaSouth AmericaSouth Central AsiaSouth Eastern AsiaSouthern EuropeSpainSri LankaSt. Vincent and the GrenadinesSudanSwedenSwitzerlandSyriaTaiwanThailandTrinidad and TobagoTurkeyUgandaUkraineUruguayUzbekistanVenezuelaVietnamWest IndiesWestern AfricaWestern AsiaWestern EuropeYemenZaireZimbabweAzores
Family Households
Income
Poverty
Unemployment
Labor Participation
Family Structure
Vehicle Availability
Education Level
Disability

Family Households Comparison

Immigrants from Hong Kong

Immigrants from Taiwan

Exceptional
Exceptional
66.1%
FAMILY HOUSEHOLDS
100.0/ 100
METRIC RATING
56th/ 347
METRIC RANK
68.0%
FAMILY HOUSEHOLDS
100.0/ 100
METRIC RATING
18th/ 347
METRIC RANK

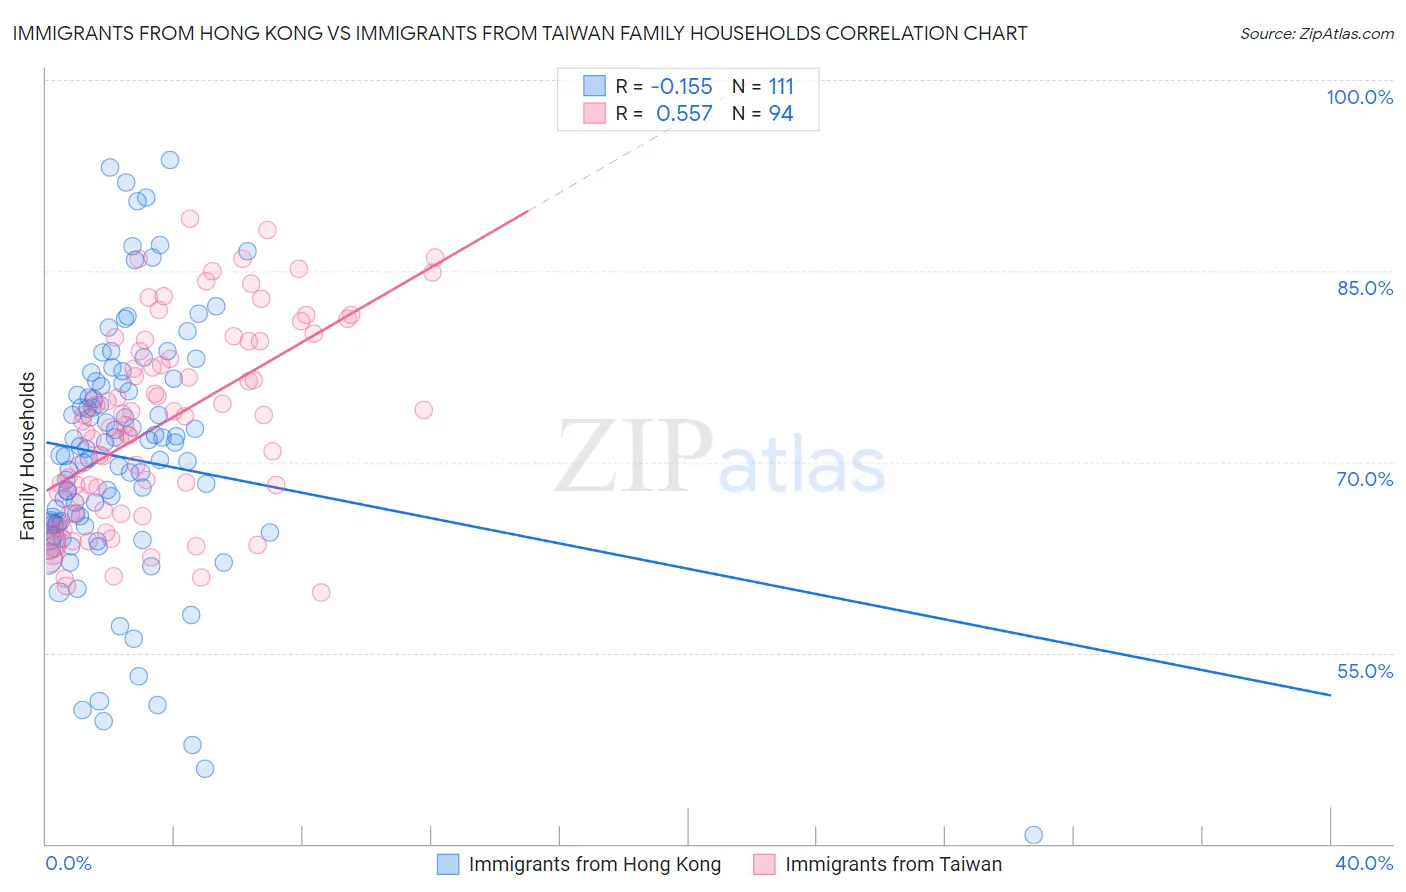
Immigrants from Hong Kong vs Immigrants from Taiwan Family Households Correlation Chart

The statistical analysis conducted on geographies consisting of 253,896,995 people shows a poor negative correlation between the proportion of Immigrants from Hong Kong and percentage of family households in the United States with a correlation coefficient (R) of -0.155 and weighted average of 66.1%. Similarly, the statistical analysis conducted on geographies consisting of 298,121,078 people shows a substantial positive correlation between the proportion of Immigrants from Taiwan and percentage of family households in the United States with a correlation coefficient (R) of 0.557 and weighted average of 68.0%, a difference of 2.9%.
Immigrants from Hong Kong vs Immigrants from Taiwan Family Households

Family Households Correlation Summary

MeasurementImmigrants from Hong KongImmigrants from Taiwan
Minimum40.7%59.8%
Maximum93.8%89.1%
Range53.1%29.3%
Mean70.3%73.0%
Median70.5%73.4%
Interquartile 25% (IQ1)65.1%66.3%
Interquartile 75% (IQ3)75.9%79.4%
Interquartile Range (IQR)10.8%13.2%
Standard Deviation (Sample)9.9%7.6%
Standard Deviation (Population)9.9%7.5%

Similar Demographics by Family Households

Demographics Similar to Immigrants from Hong Kong by Family Households

In terms of family households, the demographic groups most similar to Immigrants from Hong Kong are Immigrants (66.1%, a difference of 0.010%), Pennsylvania German (66.1%, a difference of 0.020%), Immigrants from Asia (66.1%, a difference of 0.13%), Immigrants from Korea (66.0%, a difference of 0.15%), and South American (66.0%, a difference of 0.15%).
DemographicsRating | RankFamily Households
Immigrants | South Central Asia
100.0
/100
|
#49
Exceptional
66.4%
Navajo
100.0
/100
|
#50
Exceptional
66.4%
Natives/Alaskans
100.0
/100
|
#51
Exceptional
66.4%
Colombians
100.0
/100
|
#52
Exceptional
66.3%
Afghans
100.0
/100
|
#53
Exceptional
66.3%
Immigrants | Colombia
100.0
/100
|
#54
Exceptional
66.3%
Immigrants | Immigrants
100.0
/100
|
#55
Exceptional
66.1%
Immigrants | Hong Kong
100.0
/100
|
#56
Exceptional
66.1%
Pennsylvania Germans
100.0
/100
|
#57
Exceptional
66.1%
Immigrants | Asia
100.0
/100
|
#58
Exceptional
66.1%
Immigrants | Korea
100.0
/100
|
#59
Exceptional
66.0%
South Americans
100.0
/100
|
#60
Exceptional
66.0%
Danes
100.0
/100
|
#61
Exceptional
66.0%
Central Americans
100.0
/100
|
#62
Exceptional
66.0%
Immigrants | Indonesia
100.0
/100
|
#63
Exceptional
66.0%

Demographics Similar to Immigrants from Taiwan by Family Households

In terms of family households, the demographic groups most similar to Immigrants from Taiwan are Samoan (67.9%, a difference of 0.12%), Chinese (68.1%, a difference of 0.16%), Immigrants from Vietnam (68.2%, a difference of 0.19%), Assyrian/Chaldean/Syriac (68.2%, a difference of 0.20%), and Pueblo (68.2%, a difference of 0.26%).
DemographicsRating | RankFamily Households
Immigrants | Central America
100.0
/100
|
#11
Exceptional
68.3%
Koreans
100.0
/100
|
#12
Exceptional
68.3%
Pueblo
100.0
/100
|
#13
Exceptional
68.2%
Immigrants | Cuba
100.0
/100
|
#14
Exceptional
68.2%
Assyrians/Chaldeans/Syriacs
100.0
/100
|
#15
Exceptional
68.2%
Immigrants | Vietnam
100.0
/100
|
#16
Exceptional
68.2%
Chinese
100.0
/100
|
#17
Exceptional
68.1%
Immigrants | Taiwan
100.0
/100
|
#18
Exceptional
68.0%
Samoans
100.0
/100
|
#19
Exceptional
67.9%
Inupiat
100.0
/100
|
#20
Exceptional
67.8%
Cubans
100.0
/100
|
#21
Exceptional
67.7%
Sri Lankans
100.0
/100
|
#22
Exceptional
67.7%
Immigrants | Pakistan
100.0
/100
|
#23
Exceptional
67.7%
Immigrants | South Eastern Asia
100.0
/100
|
#24
Exceptional
67.5%
Immigrants | Nicaragua
100.0
/100
|
#25
Exceptional
67.5%