Hmong vs Immigrants from Taiwan Family Households
COMPARE
Hmong
Immigrants from Taiwan
Family Households
Family Households Comparison
Hmong
Immigrants from Taiwan
64.9%
FAMILY HOUSEHOLDS
93.4/ 100
METRIC RATING
122nd/ 347
METRIC RANK
68.0%
FAMILY HOUSEHOLDS
100.0/ 100
METRIC RATING
18th/ 347
METRIC RANK
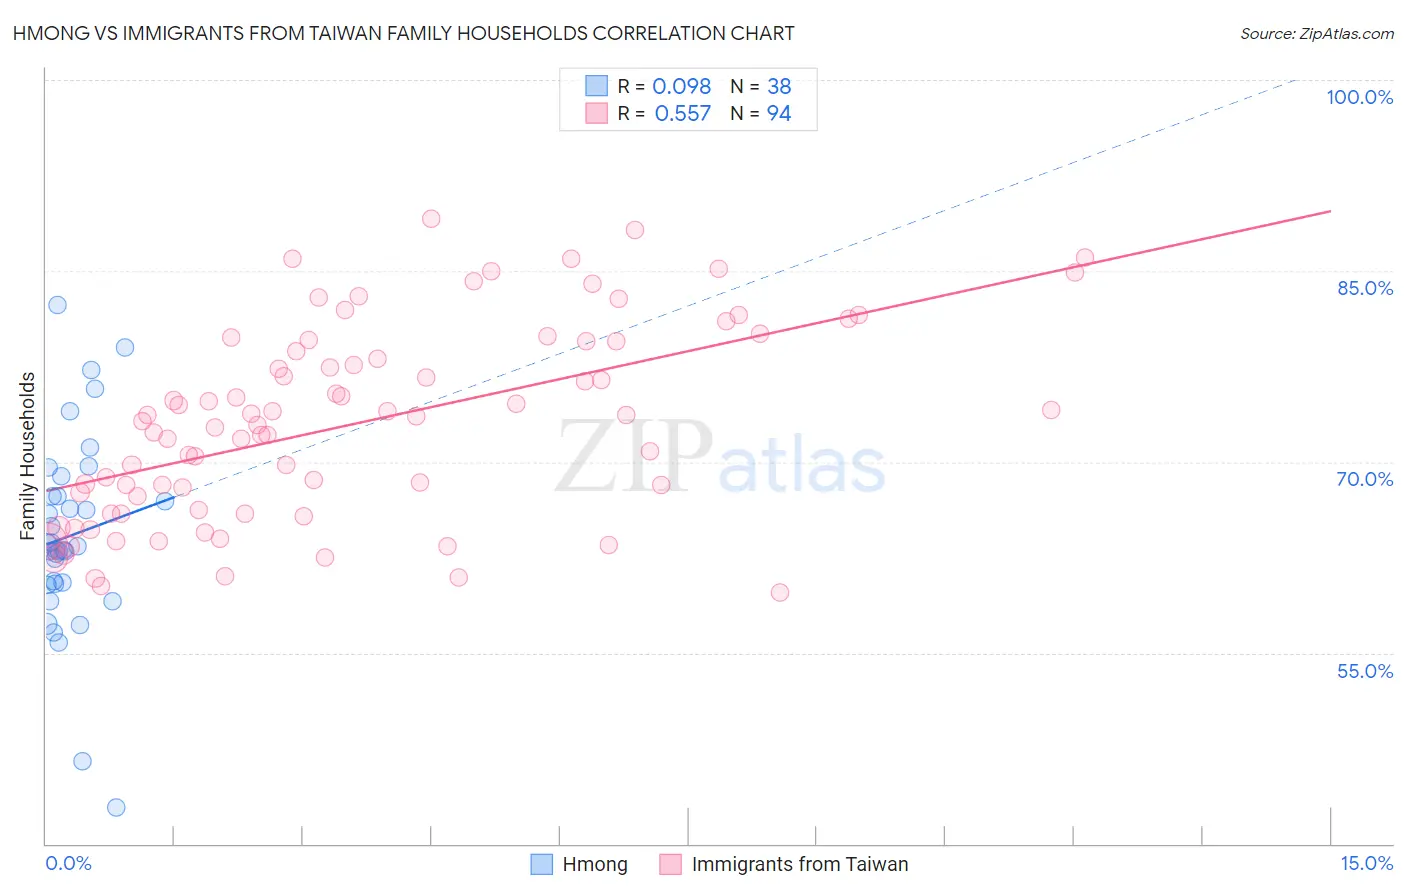
Hmong vs Immigrants from Taiwan Family Households Correlation Chart
The statistical analysis conducted on geographies consisting of 24,604,422 people shows a slight positive correlation between the proportion of Hmong and percentage of family households in the United States with a correlation coefficient (R) of 0.098 and weighted average of 64.9%. Similarly, the statistical analysis conducted on geographies consisting of 298,121,078 people shows a substantial positive correlation between the proportion of Immigrants from Taiwan and percentage of family households in the United States with a correlation coefficient (R) of 0.557 and weighted average of 68.0%, a difference of 4.9%.
Family Households Correlation Summary
| Measurement | Hmong | Immigrants from Taiwan |
| Minimum | 42.8% | 59.8% |
| Maximum | 82.3% | 89.1% |
| Range | 39.5% | 29.3% |
| Mean | 64.2% | 73.0% |
| Median | 63.3% | 73.4% |
| Interquartile 25% (IQ1) | 60.4% | 66.3% |
| Interquartile 75% (IQ3) | 67.3% | 79.4% |
| Interquartile Range (IQR) | 6.9% | 13.2% |
| Standard Deviation (Sample) | 7.8% | 7.6% |
| Standard Deviation (Population) | 7.7% | 7.5% |
Similar Demographics by Family Households
Demographics Similar to Hmong by Family Households
In terms of family households, the demographic groups most similar to Hmong are Choctaw (64.9%, a difference of 0.0%), Immigrants from Argentina (64.9%, a difference of 0.030%), Immigrants from Belize (64.9%, a difference of 0.030%), Hungarian (64.9%, a difference of 0.040%), and Immigrants from Oceania (64.9%, a difference of 0.050%).
| Demographics | Rating | Rank | Family Households |
| Ecuadorians | 95.4 /100 | #115 | Exceptional 65.0% |
| Immigrants | Iraq | 95.4 /100 | #116 | Exceptional 65.0% |
| Cherokee | 95.3 /100 | #117 | Exceptional 65.0% |
| Dutch | 95.1 /100 | #118 | Exceptional 64.9% |
| Immigrants | Eastern Asia | 94.4 /100 | #119 | Exceptional 64.9% |
| Immigrants | Oceania | 94.2 /100 | #120 | Exceptional 64.9% |
| Hungarians | 94.0 /100 | #121 | Exceptional 64.9% |
| Hmong | 93.4 /100 | #122 | Exceptional 64.9% |
| Choctaw | 93.4 /100 | #123 | Exceptional 64.9% |
| Immigrants | Argentina | 92.8 /100 | #124 | Exceptional 64.9% |
| Immigrants | Belize | 92.7 /100 | #125 | Exceptional 64.9% |
| Panamanians | 92.4 /100 | #126 | Exceptional 64.8% |
| Immigrants | Panama | 92.0 /100 | #127 | Exceptional 64.8% |
| Italians | 91.9 /100 | #128 | Exceptional 64.8% |
| Immigrants | Ecuador | 91.4 /100 | #129 | Exceptional 64.8% |
Demographics Similar to Immigrants from Taiwan by Family Households
In terms of family households, the demographic groups most similar to Immigrants from Taiwan are Samoan (67.9%, a difference of 0.12%), Chinese (68.1%, a difference of 0.16%), Immigrants from Vietnam (68.2%, a difference of 0.19%), Assyrian/Chaldean/Syriac (68.2%, a difference of 0.20%), and Pueblo (68.2%, a difference of 0.26%).
| Demographics | Rating | Rank | Family Households |
| Immigrants | Central America | 100.0 /100 | #11 | Exceptional 68.3% |
| Koreans | 100.0 /100 | #12 | Exceptional 68.3% |
| Pueblo | 100.0 /100 | #13 | Exceptional 68.2% |
| Immigrants | Cuba | 100.0 /100 | #14 | Exceptional 68.2% |
| Assyrians/Chaldeans/Syriacs | 100.0 /100 | #15 | Exceptional 68.2% |
| Immigrants | Vietnam | 100.0 /100 | #16 | Exceptional 68.2% |
| Chinese | 100.0 /100 | #17 | Exceptional 68.1% |
| Immigrants | Taiwan | 100.0 /100 | #18 | Exceptional 68.0% |
| Samoans | 100.0 /100 | #19 | Exceptional 67.9% |
| Inupiat | 100.0 /100 | #20 | Exceptional 67.8% |
| Cubans | 100.0 /100 | #21 | Exceptional 67.7% |
| Sri Lankans | 100.0 /100 | #22 | Exceptional 67.7% |
| Immigrants | Pakistan | 100.0 /100 | #23 | Exceptional 67.7% |
| Immigrants | South Eastern Asia | 100.0 /100 | #24 | Exceptional 67.5% |
| Immigrants | Nicaragua | 100.0 /100 | #25 | Exceptional 67.5% |