Osage vs Palestinian Married-couple Households
COMPARE
Osage
Palestinian
Married-couple Households
Married-couple Households Comparison
Osage
Palestinians
46.9%
MARRIED-COUPLE HOUSEHOLDS
73.2/ 100
METRIC RATING
159th/ 347
METRIC RANK
48.0%
MARRIED-COUPLE HOUSEHOLDS
96.9/ 100
METRIC RATING
92nd/ 347
METRIC RANK
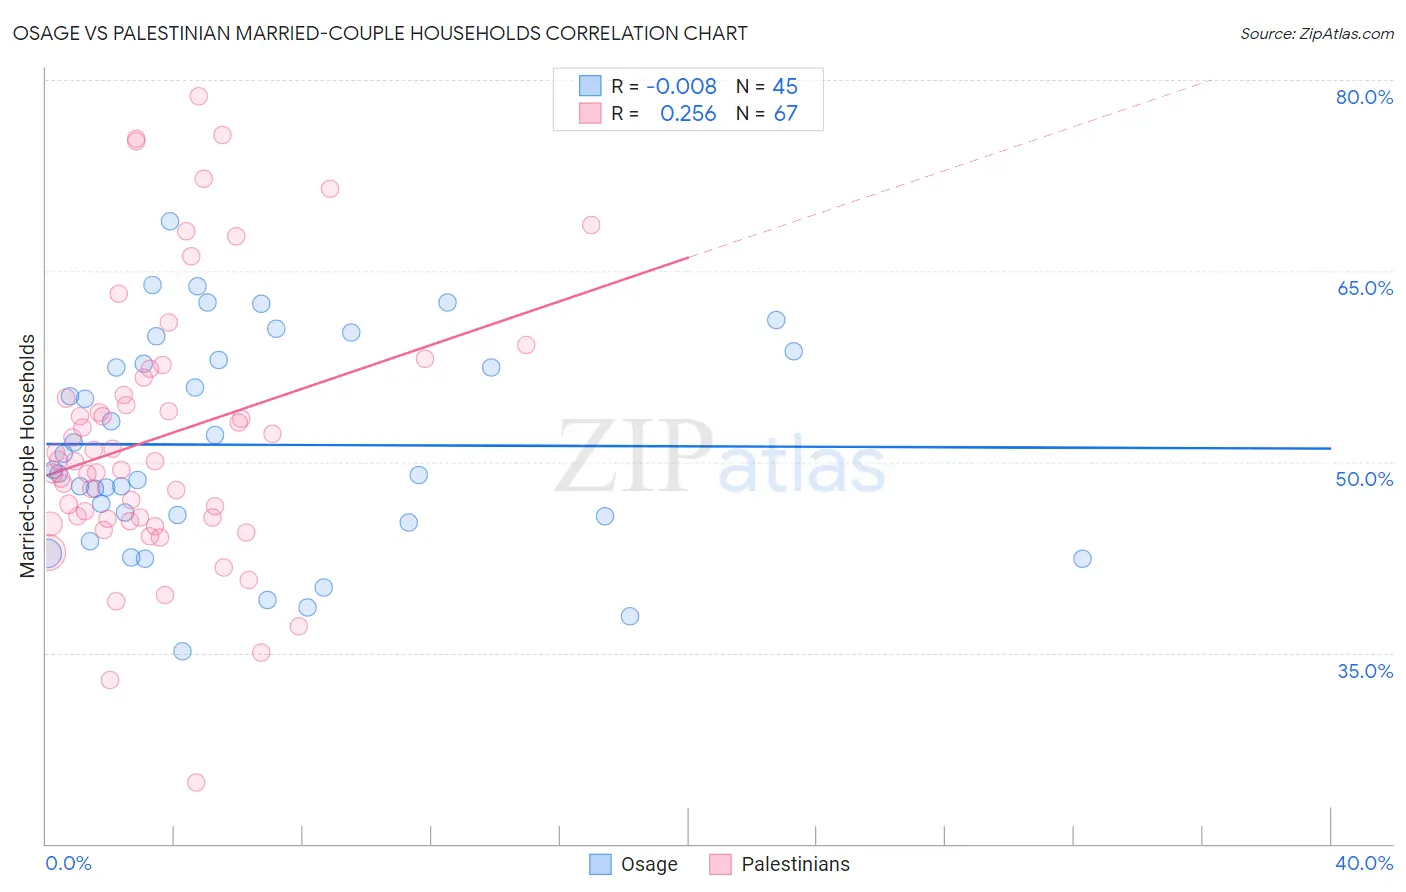
Osage vs Palestinian Married-couple Households Correlation Chart
The statistical analysis conducted on geographies consisting of 91,797,548 people shows no correlation between the proportion of Osage and percentage of married-couple family households in the United States with a correlation coefficient (R) of -0.008 and weighted average of 46.9%. Similarly, the statistical analysis conducted on geographies consisting of 216,389,787 people shows a weak positive correlation between the proportion of Palestinians and percentage of married-couple family households in the United States with a correlation coefficient (R) of 0.256 and weighted average of 48.0%, a difference of 2.3%.
Married-couple Households Correlation Summary
| Measurement | Osage | Palestinian |
| Minimum | 35.1% | 24.9% |
| Maximum | 68.9% | 78.7% |
| Range | 33.8% | 53.9% |
| Mean | 51.3% | 52.0% |
| Median | 49.4% | 50.1% |
| Interquartile 25% (IQ1) | 45.5% | 45.5% |
| Interquartile 75% (IQ3) | 58.3% | 56.6% |
| Interquartile Range (IQR) | 12.9% | 11.1% |
| Standard Deviation (Sample) | 8.3% | 10.7% |
| Standard Deviation (Population) | 8.2% | 10.6% |
Similar Demographics by Married-couple Households
Demographics Similar to Osage by Married-couple Households
In terms of married-couple households, the demographic groups most similar to Osage are Nonimmigrants (46.9%, a difference of 0.0%), Iraqi (46.9%, a difference of 0.070%), Immigrants from Oceania (46.9%, a difference of 0.080%), Delaware (46.8%, a difference of 0.090%), and Armenian (46.9%, a difference of 0.10%).
| Demographics | Rating | Rank | Married-couple Households |
| Serbians | 76.3 /100 | #152 | Good 47.0% |
| Hmong | 76.2 /100 | #153 | Good 47.0% |
| Immigrants | Western Asia | 76.1 /100 | #154 | Good 46.9% |
| Arabs | 76.0 /100 | #155 | Good 46.9% |
| Armenians | 75.4 /100 | #156 | Good 46.9% |
| Immigrants | Oceania | 74.8 /100 | #157 | Good 46.9% |
| Immigrants | Nonimmigrants | 73.3 /100 | #158 | Good 46.9% |
| Osage | 73.2 /100 | #159 | Good 46.9% |
| Iraqis | 71.7 /100 | #160 | Good 46.9% |
| Delaware | 71.2 /100 | #161 | Good 46.8% |
| Colombians | 71.0 /100 | #162 | Good 46.8% |
| Immigrants | Turkey | 70.2 /100 | #163 | Good 46.8% |
| Immigrants | Kazakhstan | 70.0 /100 | #164 | Good 46.8% |
| Immigrants | Southern Europe | 69.9 /100 | #165 | Good 46.8% |
| Cherokee | 65.7 /100 | #166 | Good 46.7% |
Demographics Similar to Palestinians by Married-couple Households
In terms of married-couple households, the demographic groups most similar to Palestinians are Immigrants from Moldova (48.0%, a difference of 0.020%), Lebanese (47.9%, a difference of 0.020%), American (47.9%, a difference of 0.020%), Immigrants from Belgium (47.9%, a difference of 0.060%), and French (48.0%, a difference of 0.080%).
| Demographics | Rating | Rank | Married-couple Households |
| Immigrants | Israel | 97.4 /100 | #85 | Exceptional 48.0% |
| Belgians | 97.4 /100 | #86 | Exceptional 48.0% |
| Immigrants | Ireland | 97.3 /100 | #87 | Exceptional 48.0% |
| Afghans | 97.3 /100 | #88 | Exceptional 48.0% |
| Cypriots | 97.2 /100 | #89 | Exceptional 48.0% |
| French | 97.2 /100 | #90 | Exceptional 48.0% |
| Immigrants | Moldova | 97.0 /100 | #91 | Exceptional 48.0% |
| Palestinians | 96.9 /100 | #92 | Exceptional 48.0% |
| Lebanese | 96.9 /100 | #93 | Exceptional 47.9% |
| Americans | 96.9 /100 | #94 | Exceptional 47.9% |
| Immigrants | Belgium | 96.8 /100 | #95 | Exceptional 47.9% |
| Immigrants | Egypt | 96.6 /100 | #96 | Exceptional 47.9% |
| Latvians | 96.5 /100 | #97 | Exceptional 47.9% |
| Immigrants | North Macedonia | 96.4 /100 | #98 | Exceptional 47.9% |
| Immigrants | Austria | 96.4 /100 | #99 | Exceptional 47.9% |