Ecuadorian vs Palestinian Married-couple Households
COMPARE
Ecuadorian
Palestinian
Married-couple Households
Married-couple Households Comparison
Ecuadorians
Palestinians
43.5%
MARRIED-COUPLE HOUSEHOLDS
0.1/ 100
METRIC RATING
266th/ 347
METRIC RANK
48.0%
MARRIED-COUPLE HOUSEHOLDS
96.9/ 100
METRIC RATING
92nd/ 347
METRIC RANK
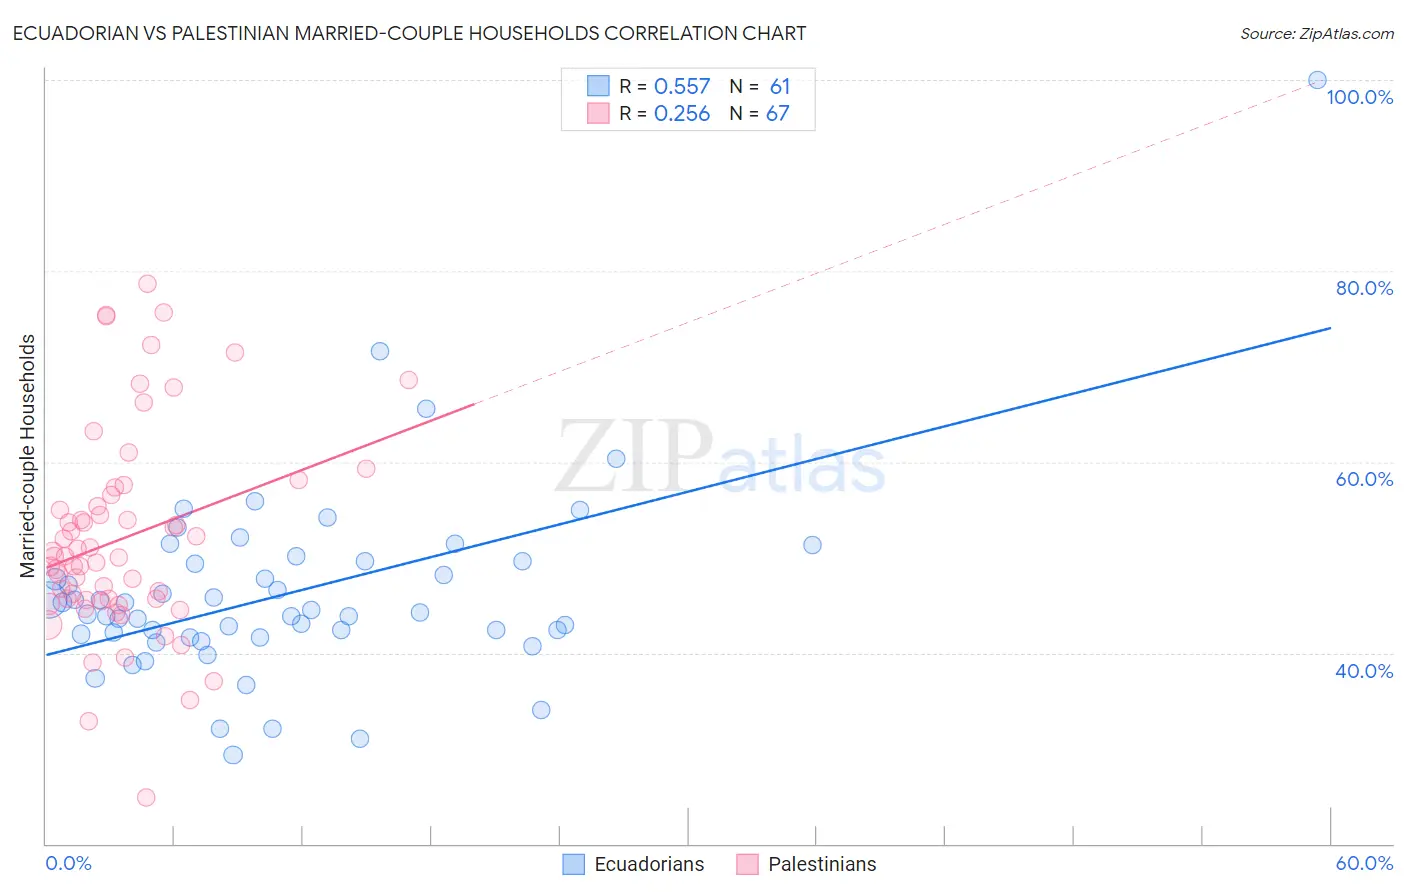
Ecuadorian vs Palestinian Married-couple Households Correlation Chart
The statistical analysis conducted on geographies consisting of 317,636,169 people shows a substantial positive correlation between the proportion of Ecuadorians and percentage of married-couple family households in the United States with a correlation coefficient (R) of 0.557 and weighted average of 43.5%. Similarly, the statistical analysis conducted on geographies consisting of 216,389,787 people shows a weak positive correlation between the proportion of Palestinians and percentage of married-couple family households in the United States with a correlation coefficient (R) of 0.256 and weighted average of 48.0%, a difference of 10.3%.
Married-couple Households Correlation Summary
| Measurement | Ecuadorian | Palestinian |
| Minimum | 29.3% | 24.9% |
| Maximum | 100.0% | 78.7% |
| Range | 70.7% | 53.9% |
| Mean | 46.3% | 52.0% |
| Median | 44.3% | 50.1% |
| Interquartile 25% (IQ1) | 41.8% | 45.5% |
| Interquartile 75% (IQ3) | 49.6% | 56.6% |
| Interquartile Range (IQR) | 7.8% | 11.1% |
| Standard Deviation (Sample) | 10.3% | 10.7% |
| Standard Deviation (Population) | 10.2% | 10.6% |
Similar Demographics by Married-couple Households
Demographics Similar to Ecuadorians by Married-couple Households
In terms of married-couple households, the demographic groups most similar to Ecuadorians are Moroccan (43.5%, a difference of 0.040%), Native/Alaskan (43.5%, a difference of 0.050%), Bangladeshi (43.5%, a difference of 0.12%), Immigrants from Burma/Myanmar (43.4%, a difference of 0.15%), and Cree (43.6%, a difference of 0.23%).
| Demographics | Rating | Rank | Married-couple Households |
| Iroquois | 0.2 /100 | #259 | Tragic 43.7% |
| Immigrants | Cameroon | 0.2 /100 | #260 | Tragic 43.7% |
| Alaskan Athabascans | 0.2 /100 | #261 | Tragic 43.6% |
| Vietnamese | 0.2 /100 | #262 | Tragic 43.6% |
| Cree | 0.1 /100 | #263 | Tragic 43.6% |
| Bangladeshis | 0.1 /100 | #264 | Tragic 43.5% |
| Moroccans | 0.1 /100 | #265 | Tragic 43.5% |
| Ecuadorians | 0.1 /100 | #266 | Tragic 43.5% |
| Natives/Alaskans | 0.1 /100 | #267 | Tragic 43.5% |
| Immigrants | Burma/Myanmar | 0.1 /100 | #268 | Tragic 43.4% |
| Immigrants | Sierra Leone | 0.1 /100 | #269 | Tragic 43.3% |
| Yuman | 0.1 /100 | #270 | Tragic 43.3% |
| Guatemalans | 0.1 /100 | #271 | Tragic 43.3% |
| Immigrants | Nigeria | 0.1 /100 | #272 | Tragic 43.2% |
| Ethiopians | 0.1 /100 | #273 | Tragic 43.2% |
Demographics Similar to Palestinians by Married-couple Households
In terms of married-couple households, the demographic groups most similar to Palestinians are Immigrants from Moldova (48.0%, a difference of 0.020%), Lebanese (47.9%, a difference of 0.020%), American (47.9%, a difference of 0.020%), Immigrants from Belgium (47.9%, a difference of 0.060%), and French (48.0%, a difference of 0.080%).
| Demographics | Rating | Rank | Married-couple Households |
| Immigrants | Israel | 97.4 /100 | #85 | Exceptional 48.0% |
| Belgians | 97.4 /100 | #86 | Exceptional 48.0% |
| Immigrants | Ireland | 97.3 /100 | #87 | Exceptional 48.0% |
| Afghans | 97.3 /100 | #88 | Exceptional 48.0% |
| Cypriots | 97.2 /100 | #89 | Exceptional 48.0% |
| French | 97.2 /100 | #90 | Exceptional 48.0% |
| Immigrants | Moldova | 97.0 /100 | #91 | Exceptional 48.0% |
| Palestinians | 96.9 /100 | #92 | Exceptional 48.0% |
| Lebanese | 96.9 /100 | #93 | Exceptional 47.9% |
| Americans | 96.9 /100 | #94 | Exceptional 47.9% |
| Immigrants | Belgium | 96.8 /100 | #95 | Exceptional 47.9% |
| Immigrants | Egypt | 96.6 /100 | #96 | Exceptional 47.9% |
| Latvians | 96.5 /100 | #97 | Exceptional 47.9% |
| Immigrants | North Macedonia | 96.4 /100 | #98 | Exceptional 47.9% |
| Immigrants | Austria | 96.4 /100 | #99 | Exceptional 47.9% |