Osage vs Palestinian Family Poverty
COMPARE
Osage
Palestinian
Family Poverty
Family Poverty Comparison
Osage
Palestinians
9.7%
FAMILY POVERTY
8.0/ 100
METRIC RATING
213th/ 347
METRIC RANK
8.3%
FAMILY POVERTY
91.1/ 100
METRIC RATING
123rd/ 347
METRIC RANK
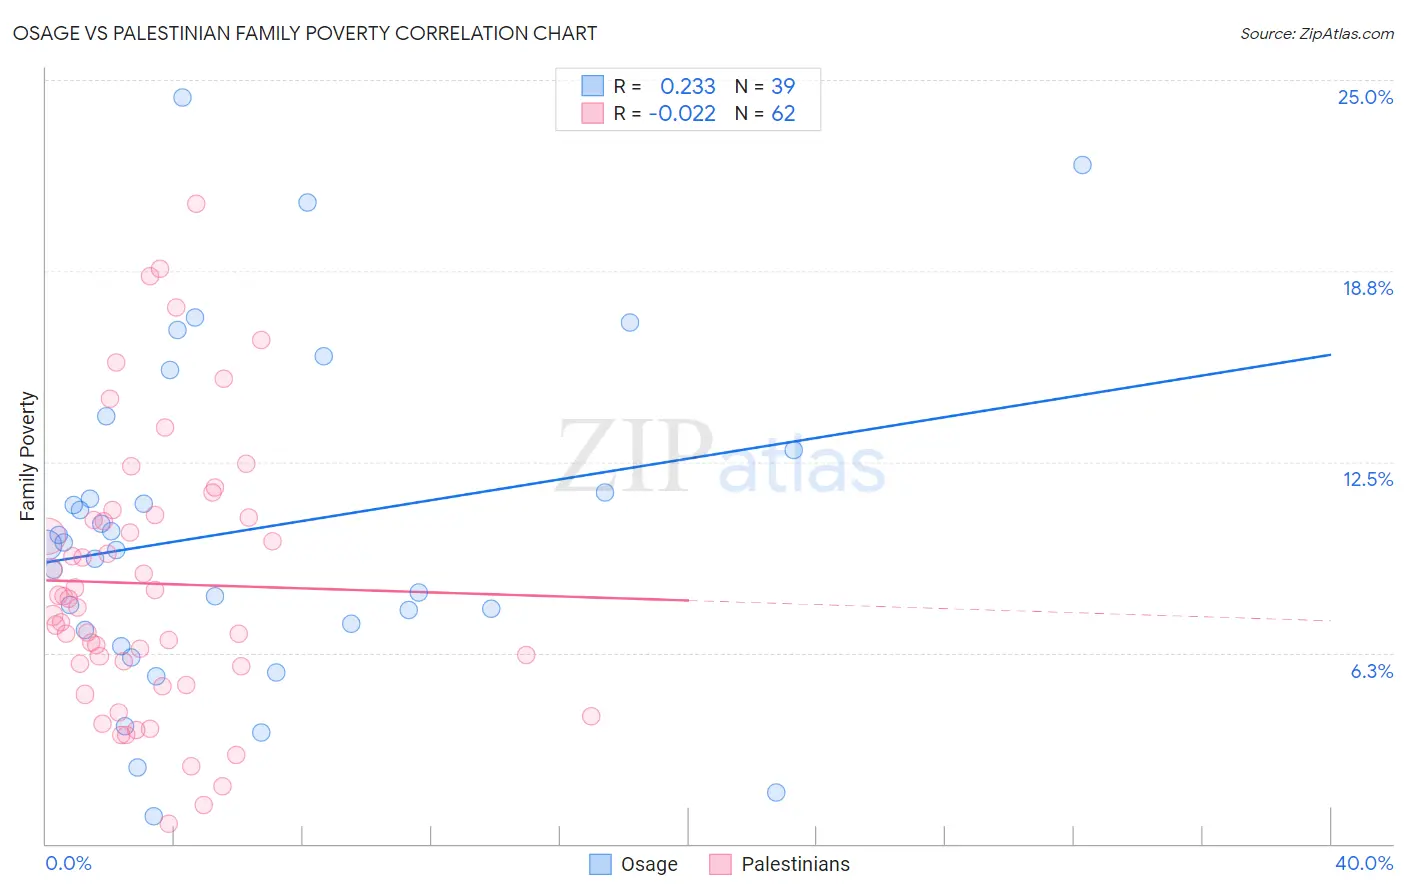
Osage vs Palestinian Family Poverty Correlation Chart
The statistical analysis conducted on geographies consisting of 91,772,722 people shows a weak positive correlation between the proportion of Osage and poverty level among families in the United States with a correlation coefficient (R) of 0.233 and weighted average of 9.7%. Similarly, the statistical analysis conducted on geographies consisting of 216,211,799 people shows no correlation between the proportion of Palestinians and poverty level among families in the United States with a correlation coefficient (R) of -0.022 and weighted average of 8.3%, a difference of 16.9%.
Family Poverty Correlation Summary
| Measurement | Osage | Palestinian |
| Minimum | 0.88% | 0.67% |
| Maximum | 24.4% | 21.0% |
| Range | 23.6% | 20.3% |
| Mean | 10.3% | 8.5% |
| Median | 9.8% | 7.9% |
| Interquartile 25% (IQ1) | 7.0% | 5.8% |
| Interquartile 75% (IQ3) | 12.9% | 10.7% |
| Interquartile Range (IQR) | 5.9% | 4.9% |
| Standard Deviation (Sample) | 5.4% | 4.5% |
| Standard Deviation (Population) | 5.4% | 4.4% |
Similar Demographics by Family Poverty
Demographics Similar to Osage by Family Poverty
In terms of family poverty, the demographic groups most similar to Osage are Immigrants from Micronesia (9.8%, a difference of 0.58%), Nonimmigrants (9.8%, a difference of 0.61%), Immigrants from Thailand (9.7%, a difference of 0.63%), Moroccan (9.8%, a difference of 0.67%), and American (9.8%, a difference of 0.87%).
| Demographics | Rating | Rank | Family Poverty |
| Immigrants | South America | 18.0 /100 | #206 | Poor 9.5% |
| Sierra Leoneans | 15.6 /100 | #207 | Poor 9.5% |
| Immigrants | Eastern Africa | 15.1 /100 | #208 | Poor 9.5% |
| Immigrants | Uruguay | 14.0 /100 | #209 | Poor 9.5% |
| Alsatians | 11.3 /100 | #210 | Poor 9.6% |
| Malaysians | 10.6 /100 | #211 | Poor 9.6% |
| Immigrants | Thailand | 9.7 /100 | #212 | Tragic 9.7% |
| Osage | 8.0 /100 | #213 | Tragic 9.7% |
| Immigrants | Micronesia | 6.7 /100 | #214 | Tragic 9.8% |
| Immigrants | Nonimmigrants | 6.7 /100 | #215 | Tragic 9.8% |
| Moroccans | 6.5 /100 | #216 | Tragic 9.8% |
| Americans | 6.2 /100 | #217 | Tragic 9.8% |
| Panamanians | 5.6 /100 | #218 | Tragic 9.8% |
| Immigrants | Eritrea | 5.4 /100 | #219 | Tragic 9.9% |
| Bermudans | 5.3 /100 | #220 | Tragic 9.9% |
Demographics Similar to Palestinians by Family Poverty
In terms of family poverty, the demographic groups most similar to Palestinians are Paraguayan (8.3%, a difference of 0.070%), Native Hawaiian (8.3%, a difference of 0.080%), Soviet Union (8.3%, a difference of 0.10%), Pakistani (8.3%, a difference of 0.14%), and Immigrants from Egypt (8.3%, a difference of 0.25%).
| Demographics | Rating | Rank | Family Poverty |
| South Africans | 93.4 /100 | #116 | Exceptional 8.2% |
| Immigrants | Russia | 93.2 /100 | #117 | Exceptional 8.2% |
| Immigrants | Western Europe | 92.9 /100 | #118 | Exceptional 8.2% |
| French | 92.8 /100 | #119 | Exceptional 8.3% |
| Immigrants | Egypt | 91.6 /100 | #120 | Exceptional 8.3% |
| Native Hawaiians | 91.3 /100 | #121 | Exceptional 8.3% |
| Paraguayans | 91.2 /100 | #122 | Exceptional 8.3% |
| Palestinians | 91.1 /100 | #123 | Exceptional 8.3% |
| Soviet Union | 90.8 /100 | #124 | Exceptional 8.3% |
| Pakistanis | 90.8 /100 | #125 | Exceptional 8.3% |
| Icelanders | 90.3 /100 | #126 | Exceptional 8.3% |
| Immigrants | Hungary | 89.9 /100 | #127 | Excellent 8.4% |
| Argentineans | 89.6 /100 | #128 | Excellent 8.4% |
| Portuguese | 89.2 /100 | #129 | Excellent 8.4% |
| Immigrants | Bosnia and Herzegovina | 88.6 /100 | #130 | Excellent 8.4% |