Osage vs Immigrants from Eastern Europe Married-couple Households
COMPARE
Osage
Immigrants from Eastern Europe
Married-couple Households
Married-couple Households Comparison
Osage
Immigrants from Eastern Europe
46.9%
MARRIED-COUPLE HOUSEHOLDS
73.2/ 100
METRIC RATING
159th/ 347
METRIC RANK
47.4%
MARRIED-COUPLE HOUSEHOLDS
90.3/ 100
METRIC RATING
121st/ 347
METRIC RANK
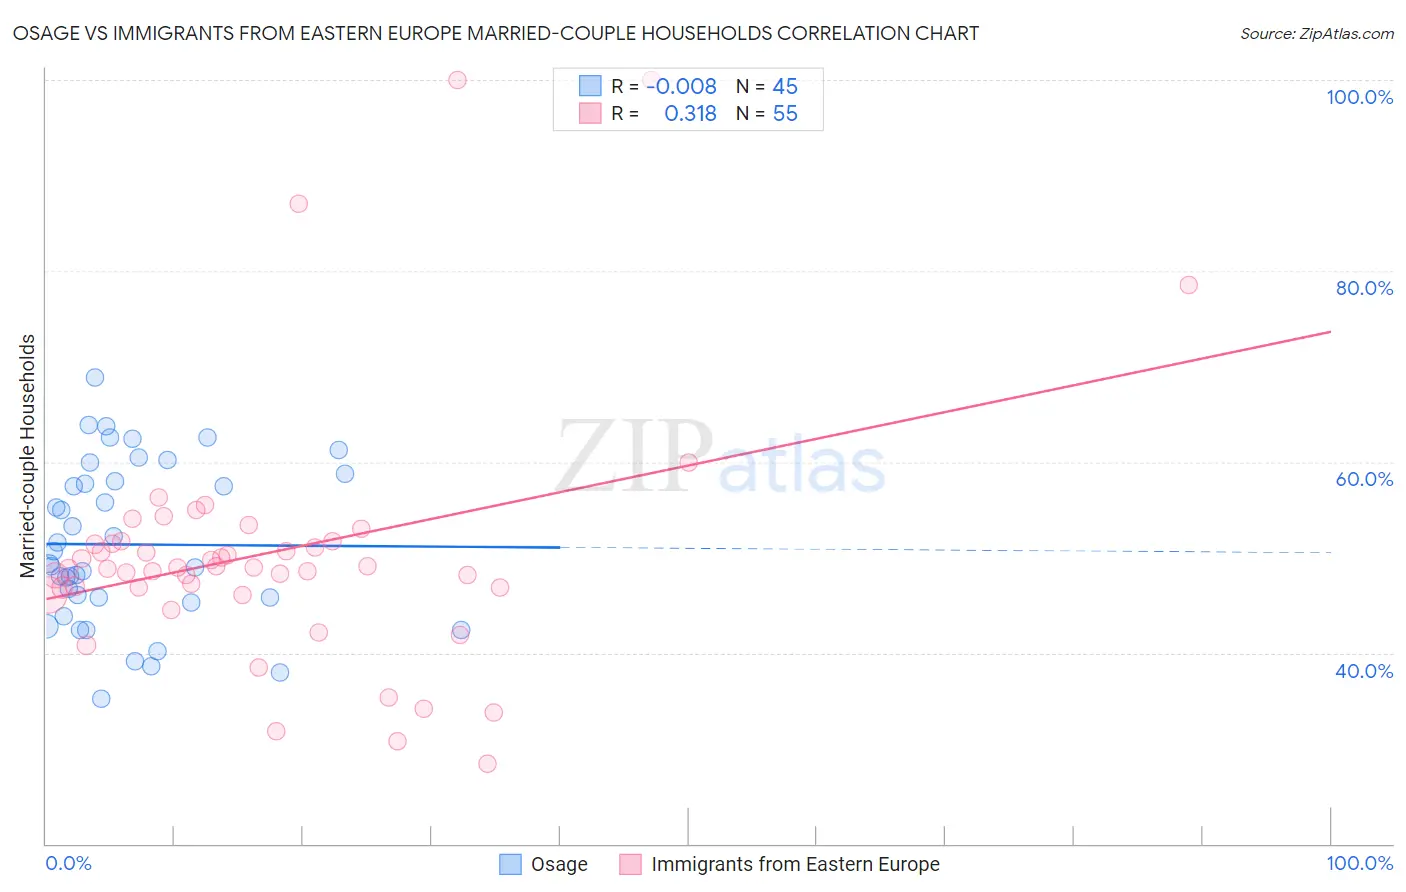
Osage vs Immigrants from Eastern Europe Married-couple Households Correlation Chart
The statistical analysis conducted on geographies consisting of 91,797,548 people shows no correlation between the proportion of Osage and percentage of married-couple family households in the United States with a correlation coefficient (R) of -0.008 and weighted average of 46.9%. Similarly, the statistical analysis conducted on geographies consisting of 475,489,582 people shows a mild positive correlation between the proportion of Immigrants from Eastern Europe and percentage of married-couple family households in the United States with a correlation coefficient (R) of 0.318 and weighted average of 47.4%, a difference of 1.1%.
Married-couple Households Correlation Summary
| Measurement | Osage | Immigrants from Eastern Europe |
| Minimum | 35.1% | 28.4% |
| Maximum | 68.9% | 100.0% |
| Range | 33.8% | 71.6% |
| Mean | 51.3% | 50.5% |
| Median | 49.4% | 49.0% |
| Interquartile 25% (IQ1) | 45.5% | 46.8% |
| Interquartile 75% (IQ3) | 58.3% | 51.7% |
| Interquartile Range (IQR) | 12.9% | 4.9% |
| Standard Deviation (Sample) | 8.3% | 13.5% |
| Standard Deviation (Population) | 8.2% | 13.4% |
Similar Demographics by Married-couple Households
Demographics Similar to Osage by Married-couple Households
In terms of married-couple households, the demographic groups most similar to Osage are Nonimmigrants (46.9%, a difference of 0.0%), Iraqi (46.9%, a difference of 0.070%), Immigrants from Oceania (46.9%, a difference of 0.080%), Delaware (46.8%, a difference of 0.090%), and Armenian (46.9%, a difference of 0.10%).
| Demographics | Rating | Rank | Married-couple Households |
| Serbians | 76.3 /100 | #152 | Good 47.0% |
| Hmong | 76.2 /100 | #153 | Good 47.0% |
| Immigrants | Western Asia | 76.1 /100 | #154 | Good 46.9% |
| Arabs | 76.0 /100 | #155 | Good 46.9% |
| Armenians | 75.4 /100 | #156 | Good 46.9% |
| Immigrants | Oceania | 74.8 /100 | #157 | Good 46.9% |
| Immigrants | Nonimmigrants | 73.3 /100 | #158 | Good 46.9% |
| Osage | 73.2 /100 | #159 | Good 46.9% |
| Iraqis | 71.7 /100 | #160 | Good 46.9% |
| Delaware | 71.2 /100 | #161 | Good 46.8% |
| Colombians | 71.0 /100 | #162 | Good 46.8% |
| Immigrants | Turkey | 70.2 /100 | #163 | Good 46.8% |
| Immigrants | Kazakhstan | 70.0 /100 | #164 | Good 46.8% |
| Immigrants | Southern Europe | 69.9 /100 | #165 | Good 46.8% |
| Cherokee | 65.7 /100 | #166 | Good 46.7% |
Demographics Similar to Immigrants from Eastern Europe by Married-couple Households
In terms of married-couple households, the demographic groups most similar to Immigrants from Eastern Europe are Puget Sound Salish (47.4%, a difference of 0.020%), Okinawan (47.4%, a difference of 0.020%), Immigrants from Venezuela (47.4%, a difference of 0.10%), Zimbabwean (47.4%, a difference of 0.11%), and Australian (47.4%, a difference of 0.13%).
| Demographics | Rating | Rank | Married-couple Households |
| Immigrants | Europe | 93.7 /100 | #114 | Exceptional 47.6% |
| Slovaks | 92.9 /100 | #115 | Exceptional 47.6% |
| Argentineans | 92.5 /100 | #116 | Exceptional 47.5% |
| French Canadians | 92.4 /100 | #117 | Exceptional 47.5% |
| Immigrants | Germany | 92.4 /100 | #118 | Exceptional 47.5% |
| Chileans | 92.2 /100 | #119 | Exceptional 47.5% |
| Puget Sound Salish | 90.5 /100 | #120 | Exceptional 47.4% |
| Immigrants | Eastern Europe | 90.3 /100 | #121 | Exceptional 47.4% |
| Okinawans | 90.1 /100 | #122 | Exceptional 47.4% |
| Immigrants | Venezuela | 89.3 /100 | #123 | Excellent 47.4% |
| Zimbabweans | 89.2 /100 | #124 | Excellent 47.4% |
| Australians | 89.0 /100 | #125 | Excellent 47.4% |
| Pakistanis | 88.6 /100 | #126 | Excellent 47.3% |
| Celtics | 88.1 /100 | #127 | Excellent 47.3% |
| Immigrants | Peru | 87.9 /100 | #128 | Excellent 47.3% |