Immigrants from Indonesia vs Lumbee Married-couple Households
COMPARE
Immigrants from Indonesia
Lumbee
Married-couple Households
Married-couple Households Comparison
Immigrants from Indonesia
Lumbee
48.5%
MARRIED-COUPLE HOUSEHOLDS
99.2/ 100
METRIC RATING
58th/ 347
METRIC RANK
39.6%
MARRIED-COUPLE HOUSEHOLDS
0.0/ 100
METRIC RATING
327th/ 347
METRIC RANK
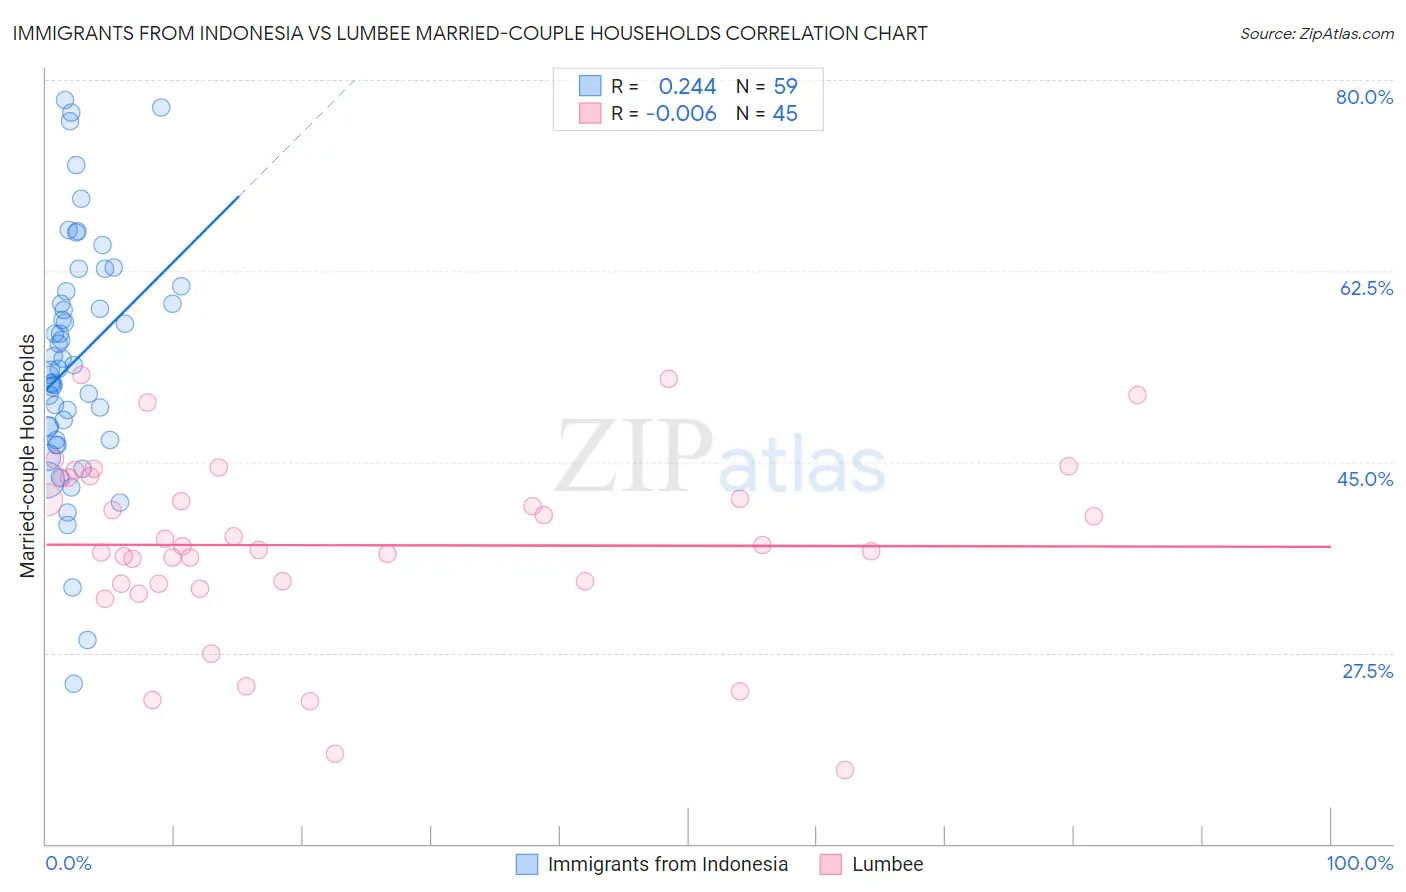
Immigrants from Indonesia vs Lumbee Married-couple Households Correlation Chart
The statistical analysis conducted on geographies consisting of 215,718,845 people shows a weak positive correlation between the proportion of Immigrants from Indonesia and percentage of married-couple family households in the United States with a correlation coefficient (R) of 0.244 and weighted average of 48.5%. Similarly, the statistical analysis conducted on geographies consisting of 92,264,260 people shows no correlation between the proportion of Lumbee and percentage of married-couple family households in the United States with a correlation coefficient (R) of -0.006 and weighted average of 39.6%, a difference of 22.6%.
Married-couple Households Correlation Summary
| Measurement | Immigrants from Indonesia | Lumbee |
| Minimum | 24.7% | 16.8% |
| Maximum | 78.1% | 53.0% |
| Range | 53.5% | 36.2% |
| Mean | 54.3% | 37.4% |
| Median | 53.5% | 37.3% |
| Interquartile 25% (IQ1) | 47.1% | 33.9% |
| Interquartile 75% (IQ3) | 60.7% | 43.5% |
| Interquartile Range (IQR) | 13.6% | 9.7% |
| Standard Deviation (Sample) | 11.1% | 8.3% |
| Standard Deviation (Population) | 11.0% | 8.2% |
Similar Demographics by Married-couple Households
Demographics Similar to Immigrants from Indonesia by Married-couple Households
In terms of married-couple households, the demographic groups most similar to Immigrants from Indonesia are Polish (48.5%, a difference of 0.0%), Czechoslovakian (48.5%, a difference of 0.0%), Croatian (48.5%, a difference of 0.080%), Austrian (48.6%, a difference of 0.090%), and Immigrants from Northern Europe (48.6%, a difference of 0.090%).
| Demographics | Rating | Rank | Married-couple Households |
| Eastern Europeans | 99.3 /100 | #51 | Exceptional 48.6% |
| Irish | 99.3 /100 | #52 | Exceptional 48.6% |
| Whites/Caucasians | 99.3 /100 | #53 | Exceptional 48.6% |
| Immigrants | Lithuania | 99.3 /100 | #54 | Exceptional 48.6% |
| Austrians | 99.3 /100 | #55 | Exceptional 48.6% |
| Immigrants | Northern Europe | 99.3 /100 | #56 | Exceptional 48.6% |
| Poles | 99.2 /100 | #57 | Exceptional 48.5% |
| Immigrants | Indonesia | 99.2 /100 | #58 | Exceptional 48.5% |
| Czechoslovakians | 99.2 /100 | #59 | Exceptional 48.5% |
| Croatians | 99.1 /100 | #60 | Exceptional 48.5% |
| Bulgarians | 99.1 /100 | #61 | Exceptional 48.5% |
| Luxembourgers | 99.1 /100 | #62 | Exceptional 48.5% |
| Basques | 99.0 /100 | #63 | Exceptional 48.4% |
| Northern Europeans | 99.0 /100 | #64 | Exceptional 48.4% |
| Immigrants | Canada | 99.0 /100 | #65 | Exceptional 48.4% |
Demographics Similar to Lumbee by Married-couple Households
In terms of married-couple households, the demographic groups most similar to Lumbee are U.S. Virgin Islander (39.8%, a difference of 0.47%), Barbadian (39.4%, a difference of 0.50%), Immigrants from Dominica (39.4%, a difference of 0.57%), Pueblo (40.0%, a difference of 0.93%), and Immigrants from Barbados (39.2%, a difference of 1.0%).
| Demographics | Rating | Rank | Married-couple Households |
| West Indians | 0.0 /100 | #320 | Tragic 40.3% |
| Immigrants | Liberia | 0.0 /100 | #321 | Tragic 40.3% |
| Immigrants | Zaire | 0.0 /100 | #322 | Tragic 40.1% |
| Puerto Ricans | 0.0 /100 | #323 | Tragic 40.1% |
| Navajo | 0.0 /100 | #324 | Tragic 40.1% |
| Pueblo | 0.0 /100 | #325 | Tragic 40.0% |
| U.S. Virgin Islanders | 0.0 /100 | #326 | Tragic 39.8% |
| Lumbee | 0.0 /100 | #327 | Tragic 39.6% |
| Barbadians | 0.0 /100 | #328 | Tragic 39.4% |
| Immigrants | Dominica | 0.0 /100 | #329 | Tragic 39.4% |
| Immigrants | Barbados | 0.0 /100 | #330 | Tragic 39.2% |
| Immigrants | Congo | 0.0 /100 | #331 | Tragic 39.0% |
| Somalis | 0.0 /100 | #332 | Tragic 39.0% |
| Immigrants | West Indies | 0.0 /100 | #333 | Tragic 39.0% |
| Immigrants | St. Vincent and the Grenadines | 0.0 /100 | #334 | Tragic 38.7% |