Nepalese vs Dominican Family Households
COMPARE
Nepalese
Dominican
Family Households
Family Households Comparison
Nepalese
Dominicans
67.2%
FAMILY HOUSEHOLDS
100.0/ 100
METRIC RATING
32nd/ 347
METRIC RANK
63.4%
FAMILY HOUSEHOLDS
1.5/ 100
METRIC RATING
248th/ 347
METRIC RANK
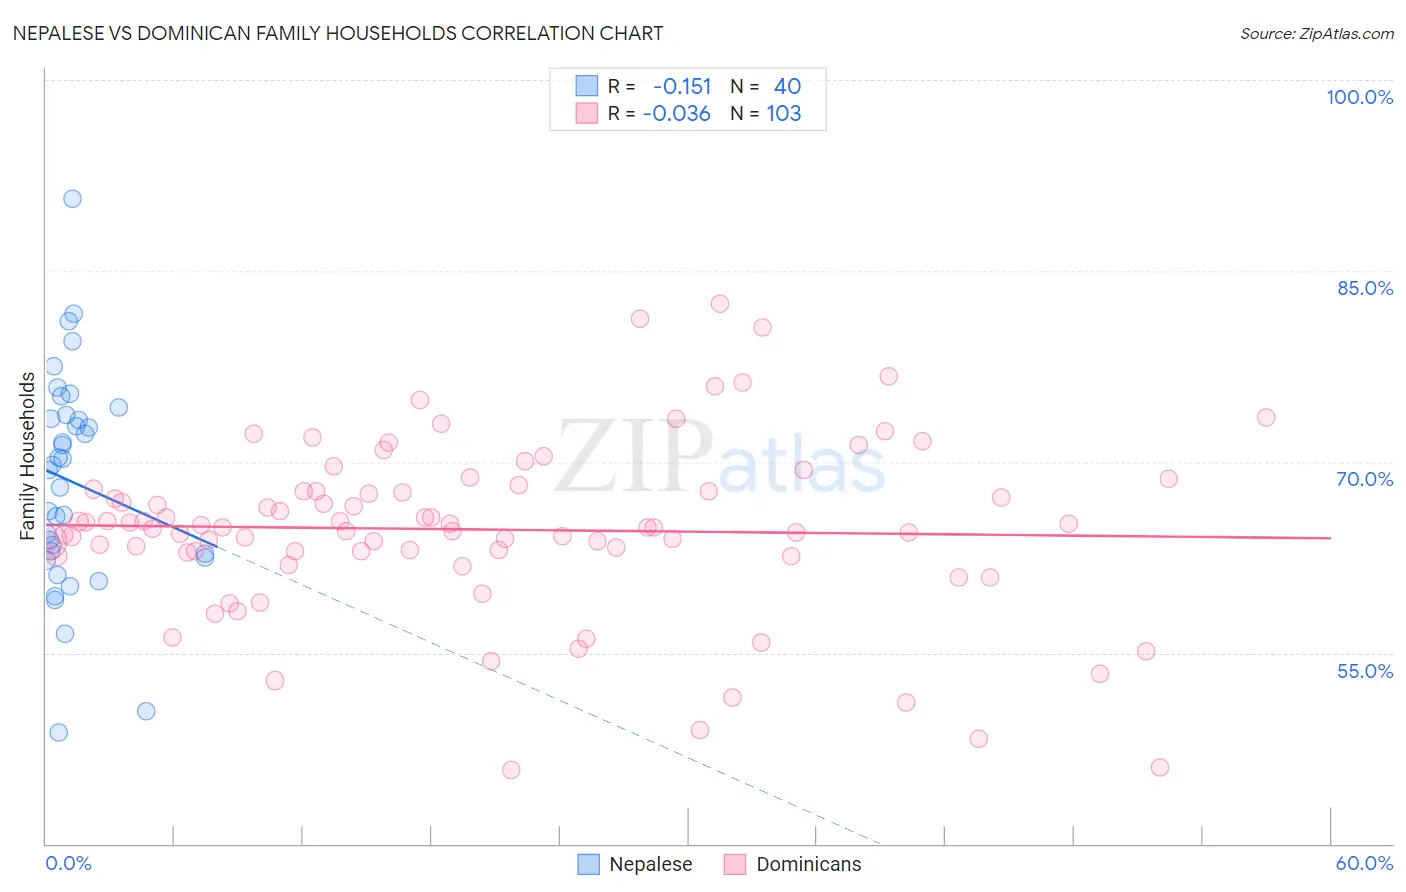
Nepalese vs Dominican Family Households Correlation Chart
The statistical analysis conducted on geographies consisting of 24,521,755 people shows a poor negative correlation between the proportion of Nepalese and percentage of family households in the United States with a correlation coefficient (R) of -0.151 and weighted average of 67.2%. Similarly, the statistical analysis conducted on geographies consisting of 354,767,002 people shows no correlation between the proportion of Dominicans and percentage of family households in the United States with a correlation coefficient (R) of -0.036 and weighted average of 63.4%, a difference of 6.0%.
Family Households Correlation Summary
| Measurement | Nepalese | Dominican |
| Minimum | 48.7% | 45.8% |
| Maximum | 90.6% | 82.4% |
| Range | 41.9% | 36.6% |
| Mean | 68.4% | 64.7% |
| Median | 69.5% | 64.9% |
| Interquartile 25% (IQ1) | 62.7% | 62.9% |
| Interquartile 75% (IQ3) | 73.5% | 67.7% |
| Interquartile Range (IQR) | 10.9% | 4.8% |
| Standard Deviation (Sample) | 8.5% | 6.8% |
| Standard Deviation (Population) | 8.4% | 6.8% |
Similar Demographics by Family Households
Demographics Similar to Nepalese by Family Households
In terms of family households, the demographic groups most similar to Nepalese are Salvadoran (67.2%, a difference of 0.040%), Thai (67.2%, a difference of 0.040%), Immigrants from Latin America (67.2%, a difference of 0.060%), Immigrants from Peru (67.2%, a difference of 0.070%), and Tohono O'odham (67.1%, a difference of 0.090%).
| Demographics | Rating | Rank | Family Households |
| Immigrants | Nicaragua | 100.0 /100 | #25 | Exceptional 67.5% |
| Immigrants | India | 100.0 /100 | #26 | Exceptional 67.4% |
| Hispanics or Latinos | 100.0 /100 | #27 | Exceptional 67.4% |
| Hawaiians | 100.0 /100 | #28 | Exceptional 67.4% |
| Nicaraguans | 100.0 /100 | #29 | Exceptional 67.4% |
| Immigrants | Peru | 100.0 /100 | #30 | Exceptional 67.2% |
| Immigrants | Latin America | 100.0 /100 | #31 | Exceptional 67.2% |
| Nepalese | 100.0 /100 | #32 | Exceptional 67.2% |
| Salvadorans | 100.0 /100 | #33 | Exceptional 67.2% |
| Thais | 100.0 /100 | #34 | Exceptional 67.2% |
| Tohono O'odham | 100.0 /100 | #35 | Exceptional 67.1% |
| Peruvians | 100.0 /100 | #36 | Exceptional 67.1% |
| Tsimshian | 100.0 /100 | #37 | Exceptional 67.1% |
| Mexican American Indians | 100.0 /100 | #38 | Exceptional 67.0% |
| Immigrants | El Salvador | 100.0 /100 | #39 | Exceptional 67.0% |
Demographics Similar to Dominicans by Family Households
In terms of family households, the demographic groups most similar to Dominicans are Immigrants from Uzbekistan (63.4%, a difference of 0.010%), Russian (63.4%, a difference of 0.010%), Immigrants from Ghana (63.4%, a difference of 0.020%), Immigrants from Japan (63.4%, a difference of 0.030%), and Eastern European (63.4%, a difference of 0.040%).
| Demographics | Rating | Rank | Family Households |
| Immigrants | St. Vincent and the Grenadines | 1.9 /100 | #241 | Tragic 63.4% |
| Immigrants | Israel | 1.8 /100 | #242 | Tragic 63.4% |
| Immigrants | Czechoslovakia | 1.8 /100 | #243 | Tragic 63.4% |
| Eastern Europeans | 1.6 /100 | #244 | Tragic 63.4% |
| Immigrants | Dominica | 1.6 /100 | #245 | Tragic 63.4% |
| Immigrants | Ghana | 1.6 /100 | #246 | Tragic 63.4% |
| Immigrants | Uzbekistan | 1.5 /100 | #247 | Tragic 63.4% |
| Dominicans | 1.5 /100 | #248 | Tragic 63.4% |
| Russians | 1.4 /100 | #249 | Tragic 63.4% |
| Immigrants | Japan | 1.4 /100 | #250 | Tragic 63.4% |
| Taiwanese | 1.2 /100 | #251 | Tragic 63.3% |
| Bahamians | 1.1 /100 | #252 | Tragic 63.3% |
| Immigrants | Dominican Republic | 1.0 /100 | #253 | Tragic 63.3% |
| Slovaks | 1.0 /100 | #254 | Tragic 63.3% |
| Potawatomi | 1.0 /100 | #255 | Tragic 63.3% |