Nepalese vs Immigrants from Uruguay Family Households
COMPARE
Nepalese
Immigrants from Uruguay
Family Households
Family Households Comparison
Nepalese
Immigrants from Uruguay
67.2%
FAMILY HOUSEHOLDS
100.0/ 100
METRIC RATING
32nd/ 347
METRIC RANK
63.9%
FAMILY HOUSEHOLDS
12.8/ 100
METRIC RATING
204th/ 347
METRIC RANK
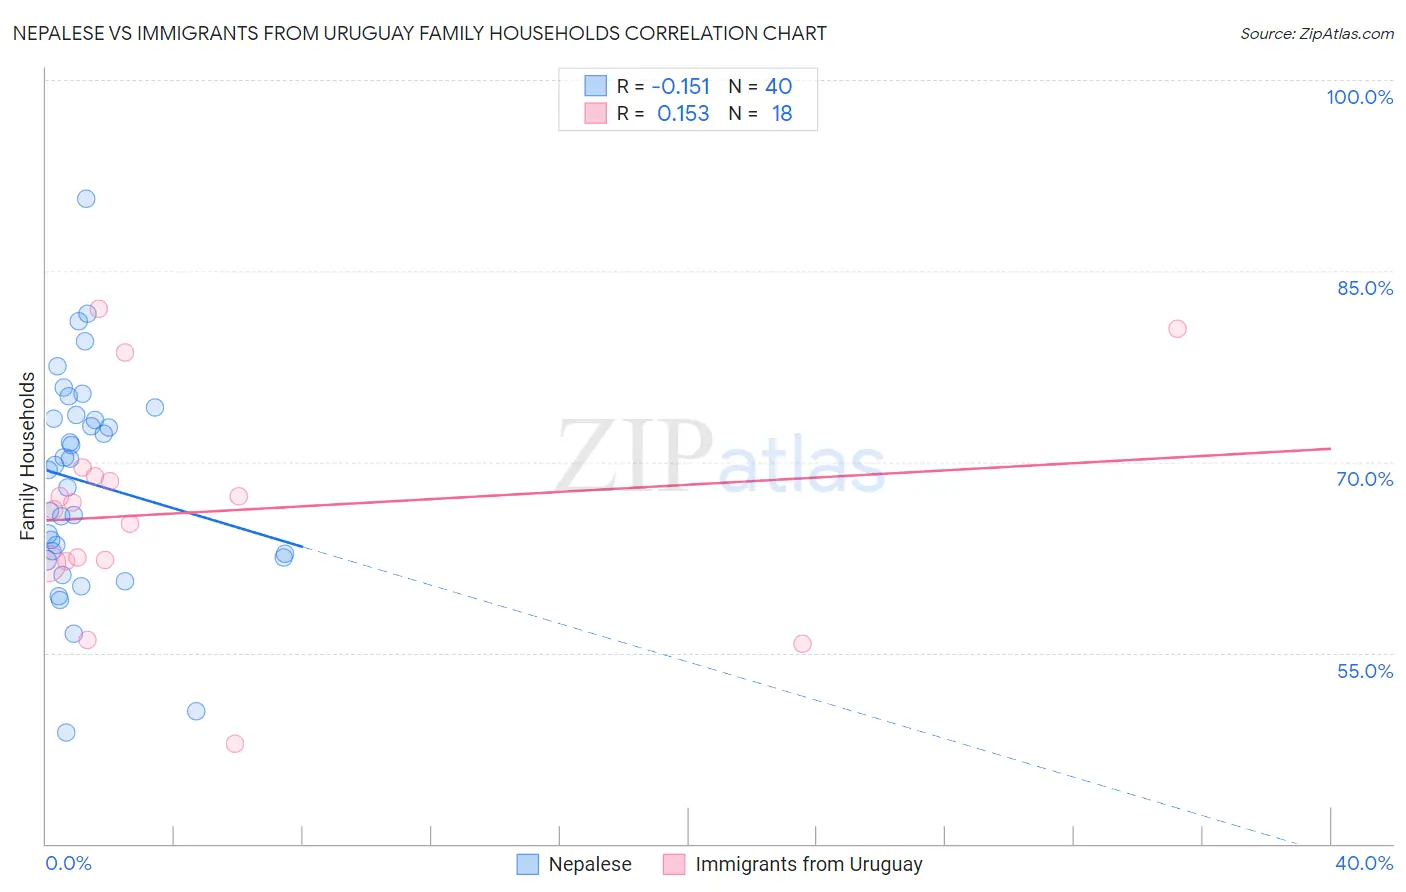
Nepalese vs Immigrants from Uruguay Family Households Correlation Chart
The statistical analysis conducted on geographies consisting of 24,521,755 people shows a poor negative correlation between the proportion of Nepalese and percentage of family households in the United States with a correlation coefficient (R) of -0.151 and weighted average of 67.2%. Similarly, the statistical analysis conducted on geographies consisting of 133,245,142 people shows a poor positive correlation between the proportion of Immigrants from Uruguay and percentage of family households in the United States with a correlation coefficient (R) of 0.153 and weighted average of 63.9%, a difference of 5.2%.
Family Households Correlation Summary
| Measurement | Nepalese | Immigrants from Uruguay |
| Minimum | 48.7% | 47.9% |
| Maximum | 90.6% | 82.0% |
| Range | 41.9% | 34.1% |
| Mean | 68.4% | 66.1% |
| Median | 69.5% | 66.5% |
| Interquartile 25% (IQ1) | 62.7% | 62.2% |
| Interquartile 75% (IQ3) | 73.5% | 68.9% |
| Interquartile Range (IQR) | 10.9% | 6.7% |
| Standard Deviation (Sample) | 8.5% | 8.6% |
| Standard Deviation (Population) | 8.4% | 8.3% |
Similar Demographics by Family Households
Demographics Similar to Nepalese by Family Households
In terms of family households, the demographic groups most similar to Nepalese are Salvadoran (67.2%, a difference of 0.040%), Thai (67.2%, a difference of 0.040%), Immigrants from Latin America (67.2%, a difference of 0.060%), Immigrants from Peru (67.2%, a difference of 0.070%), and Tohono O'odham (67.1%, a difference of 0.090%).
| Demographics | Rating | Rank | Family Households |
| Immigrants | Nicaragua | 100.0 /100 | #25 | Exceptional 67.5% |
| Immigrants | India | 100.0 /100 | #26 | Exceptional 67.4% |
| Hispanics or Latinos | 100.0 /100 | #27 | Exceptional 67.4% |
| Hawaiians | 100.0 /100 | #28 | Exceptional 67.4% |
| Nicaraguans | 100.0 /100 | #29 | Exceptional 67.4% |
| Immigrants | Peru | 100.0 /100 | #30 | Exceptional 67.2% |
| Immigrants | Latin America | 100.0 /100 | #31 | Exceptional 67.2% |
| Nepalese | 100.0 /100 | #32 | Exceptional 67.2% |
| Salvadorans | 100.0 /100 | #33 | Exceptional 67.2% |
| Thais | 100.0 /100 | #34 | Exceptional 67.2% |
| Tohono O'odham | 100.0 /100 | #35 | Exceptional 67.1% |
| Peruvians | 100.0 /100 | #36 | Exceptional 67.1% |
| Tsimshian | 100.0 /100 | #37 | Exceptional 67.1% |
| Mexican American Indians | 100.0 /100 | #38 | Exceptional 67.0% |
| Immigrants | El Salvador | 100.0 /100 | #39 | Exceptional 67.0% |
Demographics Similar to Immigrants from Uruguay by Family Households
In terms of family households, the demographic groups most similar to Immigrants from Uruguay are Norwegian (63.9%, a difference of 0.010%), Brazilian (63.9%, a difference of 0.010%), Iranian (63.9%, a difference of 0.020%), Immigrants from Lithuania (63.9%, a difference of 0.020%), and Nigerian (63.9%, a difference of 0.040%).
| Demographics | Rating | Rank | Family Households |
| Seminole | 18.9 /100 | #197 | Poor 64.0% |
| Poles | 18.9 /100 | #198 | Poor 64.0% |
| Slavs | 18.6 /100 | #199 | Poor 64.0% |
| Immigrants | Malaysia | 17.9 /100 | #200 | Poor 64.0% |
| Immigrants | Eastern Europe | 17.2 /100 | #201 | Poor 64.0% |
| Iranians | 13.5 /100 | #202 | Poor 63.9% |
| Norwegians | 13.2 /100 | #203 | Poor 63.9% |
| Immigrants | Uruguay | 12.8 /100 | #204 | Poor 63.9% |
| Brazilians | 12.4 /100 | #205 | Poor 63.9% |
| Immigrants | Lithuania | 12.1 /100 | #206 | Poor 63.9% |
| Nigerians | 11.5 /100 | #207 | Poor 63.9% |
| Immigrants | Bangladesh | 11.4 /100 | #208 | Poor 63.9% |
| Sierra Leoneans | 11.2 /100 | #209 | Poor 63.9% |
| Immigrants | Thailand | 9.6 /100 | #210 | Tragic 63.8% |
| Shoshone | 9.4 /100 | #211 | Tragic 63.8% |