Blackfeet vs Dominican Family Households
COMPARE
Blackfeet
Dominican
Family Households
Family Households Comparison
Blackfeet
Dominicans
63.6%
FAMILY HOUSEHOLDS
3.6/ 100
METRIC RATING
228th/ 347
METRIC RANK
63.4%
FAMILY HOUSEHOLDS
1.5/ 100
METRIC RATING
248th/ 347
METRIC RANK
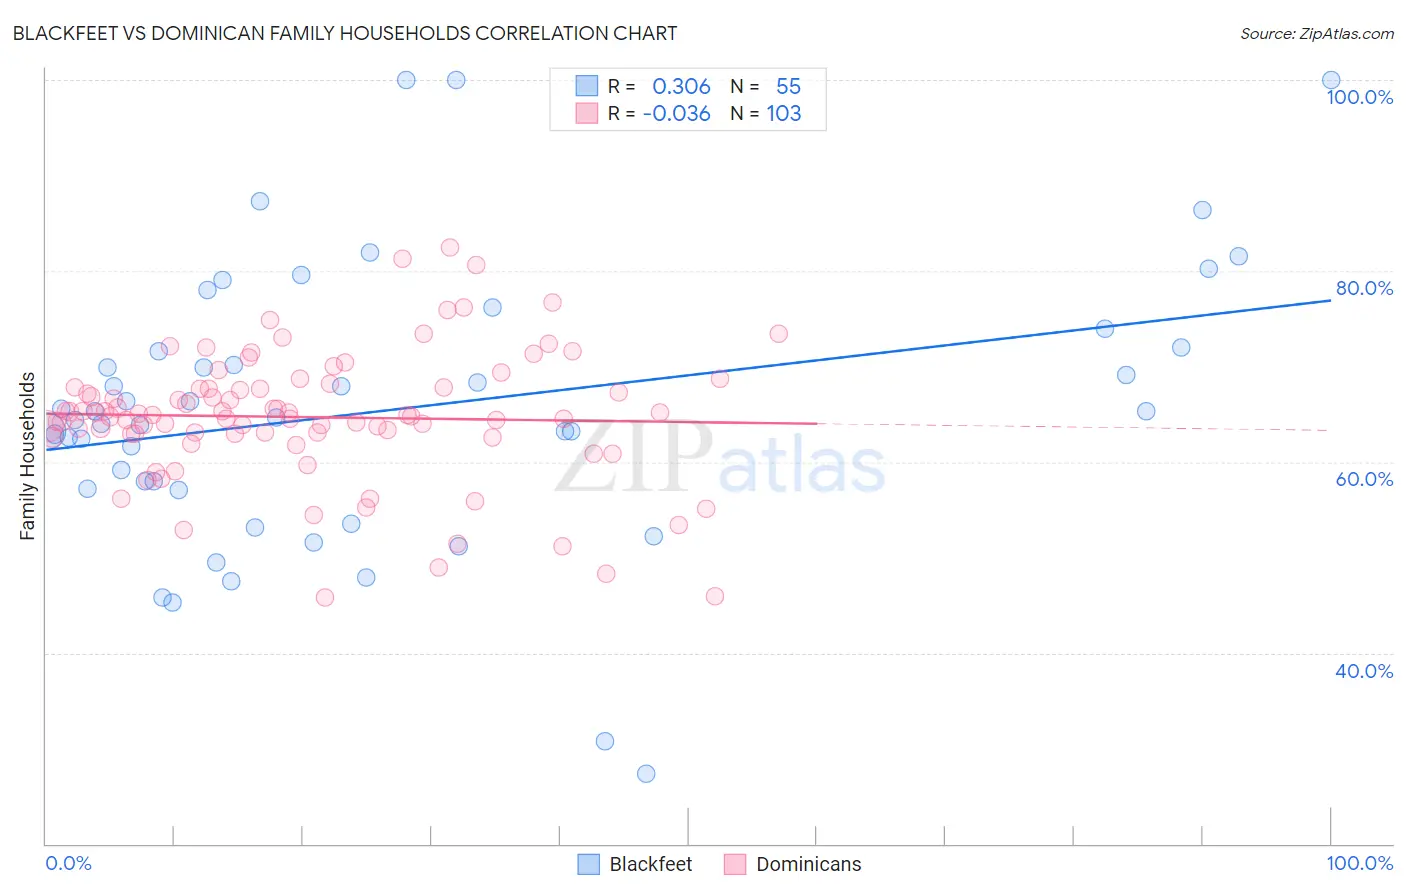
Blackfeet vs Dominican Family Households Correlation Chart
The statistical analysis conducted on geographies consisting of 309,476,715 people shows a mild positive correlation between the proportion of Blackfeet and percentage of family households in the United States with a correlation coefficient (R) of 0.306 and weighted average of 63.6%. Similarly, the statistical analysis conducted on geographies consisting of 354,767,002 people shows no correlation between the proportion of Dominicans and percentage of family households in the United States with a correlation coefficient (R) of -0.036 and weighted average of 63.4%, a difference of 0.31%.
Family Households Correlation Summary
| Measurement | Blackfeet | Dominican |
| Minimum | 27.3% | 45.8% |
| Maximum | 100.0% | 82.4% |
| Range | 72.7% | 36.6% |
| Mean | 65.5% | 64.7% |
| Median | 64.6% | 64.9% |
| Interquartile 25% (IQ1) | 57.2% | 62.9% |
| Interquartile 75% (IQ3) | 72.0% | 67.7% |
| Interquartile Range (IQR) | 14.9% | 4.8% |
| Standard Deviation (Sample) | 14.7% | 6.8% |
| Standard Deviation (Population) | 14.6% | 6.8% |
Demographics Similar to Blackfeet and Dominicans by Family Households
In terms of family households, the demographic groups most similar to Blackfeet are Bulgarian (63.6%, a difference of 0.020%), Immigrants from Brazil (63.6%, a difference of 0.060%), Immigrants from Greece (63.5%, a difference of 0.070%), Immigrants from Northern Africa (63.5%, a difference of 0.11%), and Immigrants from Armenia (63.5%, a difference of 0.12%). Similarly, the demographic groups most similar to Dominicans are Immigrants from Uzbekistan (63.4%, a difference of 0.010%), Immigrants from Ghana (63.4%, a difference of 0.020%), Eastern European (63.4%, a difference of 0.040%), Immigrants from Dominica (63.4%, a difference of 0.040%), and Immigrants from Czechoslovakia (63.4%, a difference of 0.060%).
| Demographics | Rating | Rank | Family Households |
| Blackfeet | 3.6 /100 | #228 | Tragic 63.6% |
| Bulgarians | 3.4 /100 | #229 | Tragic 63.6% |
| Immigrants | Brazil | 3.0 /100 | #230 | Tragic 63.6% |
| Immigrants | Greece | 2.9 /100 | #231 | Tragic 63.5% |
| Immigrants | Northern Africa | 2.6 /100 | #232 | Tragic 63.5% |
| Immigrants | Armenia | 2.6 /100 | #233 | Tragic 63.5% |
| Finns | 2.3 /100 | #234 | Tragic 63.5% |
| Albanians | 2.2 /100 | #235 | Tragic 63.5% |
| Ghanaians | 2.1 /100 | #236 | Tragic 63.5% |
| Comanche | 2.1 /100 | #237 | Tragic 63.5% |
| Immigrants | Zimbabwe | 2.0 /100 | #238 | Tragic 63.5% |
| Aleuts | 1.9 /100 | #239 | Tragic 63.4% |
| South Africans | 1.9 /100 | #240 | Tragic 63.4% |
| Immigrants | St. Vincent and the Grenadines | 1.9 /100 | #241 | Tragic 63.4% |
| Immigrants | Israel | 1.8 /100 | #242 | Tragic 63.4% |
| Immigrants | Czechoslovakia | 1.8 /100 | #243 | Tragic 63.4% |
| Eastern Europeans | 1.6 /100 | #244 | Tragic 63.4% |
| Immigrants | Dominica | 1.6 /100 | #245 | Tragic 63.4% |
| Immigrants | Ghana | 1.6 /100 | #246 | Tragic 63.4% |
| Immigrants | Uzbekistan | 1.5 /100 | #247 | Tragic 63.4% |
| Dominicans | 1.5 /100 | #248 | Tragic 63.4% |