Moroccan vs Immigrants from Sudan Married-couple Households
COMPARE
Moroccan
Immigrants from Sudan
Married-couple Households
Married-couple Households Comparison
Moroccans
Immigrants from Sudan
43.5%
MARRIED-COUPLE HOUSEHOLDS
0.1/ 100
METRIC RATING
265th/ 347
METRIC RANK
41.9%
MARRIED-COUPLE HOUSEHOLDS
0.0/ 100
METRIC RATING
296th/ 347
METRIC RANK
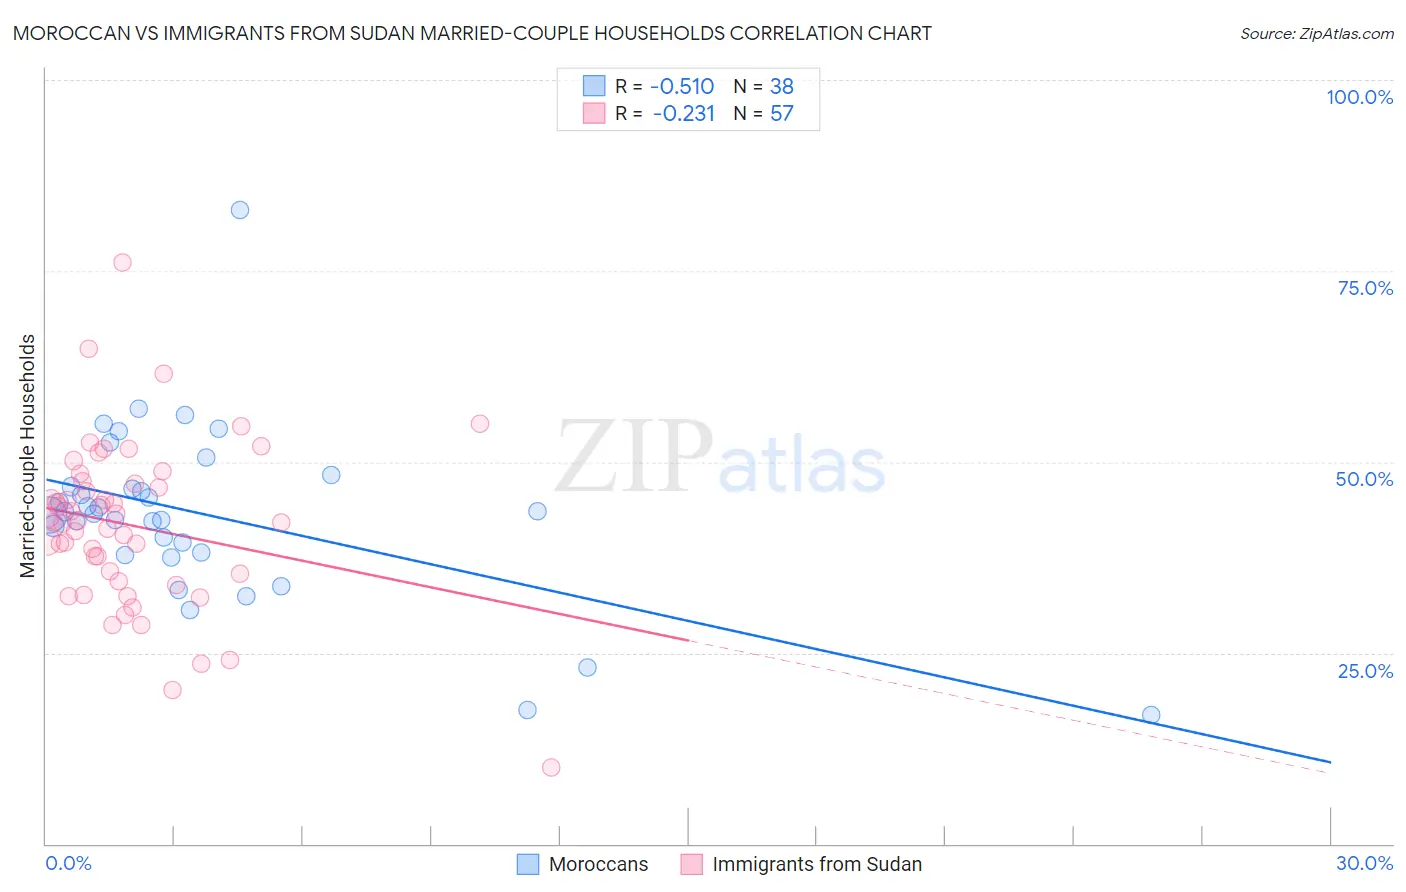
Moroccan vs Immigrants from Sudan Married-couple Households Correlation Chart
The statistical analysis conducted on geographies consisting of 201,755,880 people shows a substantial negative correlation between the proportion of Moroccans and percentage of married-couple family households in the United States with a correlation coefficient (R) of -0.510 and weighted average of 43.5%. Similarly, the statistical analysis conducted on geographies consisting of 118,946,439 people shows a weak negative correlation between the proportion of Immigrants from Sudan and percentage of married-couple family households in the United States with a correlation coefficient (R) of -0.231 and weighted average of 41.9%, a difference of 3.7%.
Married-couple Households Correlation Summary
| Measurement | Moroccan | Immigrants from Sudan |
| Minimum | 16.8% | 10.0% |
| Maximum | 83.0% | 76.0% |
| Range | 66.2% | 66.0% |
| Mean | 43.1% | 41.7% |
| Median | 43.3% | 42.1% |
| Interquartile 25% (IQ1) | 38.2% | 34.9% |
| Interquartile 75% (IQ3) | 46.7% | 47.3% |
| Interquartile Range (IQR) | 8.5% | 12.4% |
| Standard Deviation (Sample) | 11.5% | 10.9% |
| Standard Deviation (Population) | 11.3% | 10.8% |
Similar Demographics by Married-couple Households
Demographics Similar to Moroccans by Married-couple Households
In terms of married-couple households, the demographic groups most similar to Moroccans are Ecuadorian (43.5%, a difference of 0.040%), Bangladeshi (43.5%, a difference of 0.080%), Native/Alaskan (43.5%, a difference of 0.090%), Cree (43.6%, a difference of 0.19%), and Immigrants from Burma/Myanmar (43.4%, a difference of 0.20%).
| Demographics | Rating | Rank | Married-couple Households |
| Central American Indians | 0.2 /100 | #258 | Tragic 43.8% |
| Iroquois | 0.2 /100 | #259 | Tragic 43.7% |
| Immigrants | Cameroon | 0.2 /100 | #260 | Tragic 43.7% |
| Alaskan Athabascans | 0.2 /100 | #261 | Tragic 43.6% |
| Vietnamese | 0.2 /100 | #262 | Tragic 43.6% |
| Cree | 0.1 /100 | #263 | Tragic 43.6% |
| Bangladeshis | 0.1 /100 | #264 | Tragic 43.5% |
| Moroccans | 0.1 /100 | #265 | Tragic 43.5% |
| Ecuadorians | 0.1 /100 | #266 | Tragic 43.5% |
| Natives/Alaskans | 0.1 /100 | #267 | Tragic 43.5% |
| Immigrants | Burma/Myanmar | 0.1 /100 | #268 | Tragic 43.4% |
| Immigrants | Sierra Leone | 0.1 /100 | #269 | Tragic 43.3% |
| Yuman | 0.1 /100 | #270 | Tragic 43.3% |
| Guatemalans | 0.1 /100 | #271 | Tragic 43.3% |
| Immigrants | Nigeria | 0.1 /100 | #272 | Tragic 43.2% |
Demographics Similar to Immigrants from Sudan by Married-couple Households
In terms of married-couple households, the demographic groups most similar to Immigrants from Sudan are Menominee (42.0%, a difference of 0.11%), Immigrants from Yemen (42.0%, a difference of 0.11%), Kiowa (42.0%, a difference of 0.11%), Indonesian (42.0%, a difference of 0.22%), and Paiute (42.1%, a difference of 0.27%).
| Demographics | Rating | Rank | Married-couple Households |
| Sudanese | 0.0 /100 | #289 | Tragic 42.1% |
| Hondurans | 0.0 /100 | #290 | Tragic 42.1% |
| Paiute | 0.0 /100 | #291 | Tragic 42.1% |
| Indonesians | 0.0 /100 | #292 | Tragic 42.0% |
| Menominee | 0.0 /100 | #293 | Tragic 42.0% |
| Immigrants | Yemen | 0.0 /100 | #294 | Tragic 42.0% |
| Kiowa | 0.0 /100 | #295 | Tragic 42.0% |
| Immigrants | Sudan | 0.0 /100 | #296 | Tragic 41.9% |
| Arapaho | 0.0 /100 | #297 | Tragic 41.8% |
| Immigrants | Middle Africa | 0.0 /100 | #298 | Tragic 41.8% |
| Immigrants | Ghana | 0.0 /100 | #299 | Tragic 41.8% |
| Immigrants | Belize | 0.0 /100 | #300 | Tragic 41.8% |
| Immigrants | Bahamas | 0.0 /100 | #301 | Tragic 41.7% |
| Immigrants | Honduras | 0.0 /100 | #302 | Tragic 41.6% |
| Sub-Saharan Africans | 0.0 /100 | #303 | Tragic 41.6% |