Zimbabwean vs Immigrants from Sudan Married-couple Households
COMPARE
Zimbabwean
Immigrants from Sudan
Married-couple Households
Married-couple Households Comparison
Zimbabweans
Immigrants from Sudan
47.4%
MARRIED-COUPLE HOUSEHOLDS
89.2/ 100
METRIC RATING
124th/ 347
METRIC RANK
41.9%
MARRIED-COUPLE HOUSEHOLDS
0.0/ 100
METRIC RATING
296th/ 347
METRIC RANK
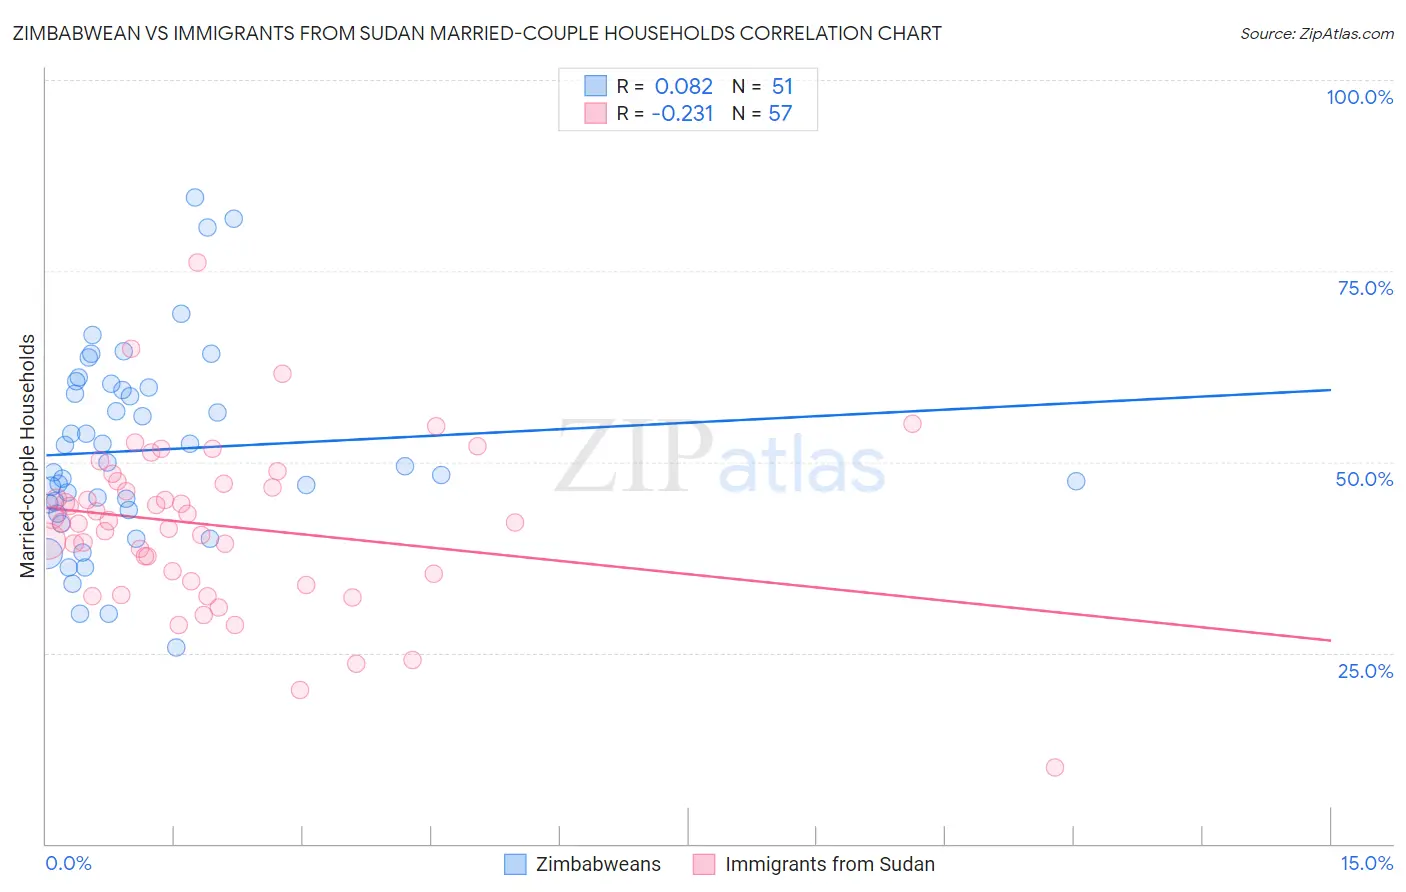
Zimbabwean vs Immigrants from Sudan Married-couple Households Correlation Chart
The statistical analysis conducted on geographies consisting of 69,192,017 people shows a slight positive correlation between the proportion of Zimbabweans and percentage of married-couple family households in the United States with a correlation coefficient (R) of 0.082 and weighted average of 47.4%. Similarly, the statistical analysis conducted on geographies consisting of 118,946,439 people shows a weak negative correlation between the proportion of Immigrants from Sudan and percentage of married-couple family households in the United States with a correlation coefficient (R) of -0.231 and weighted average of 41.9%, a difference of 12.9%.
Married-couple Households Correlation Summary
| Measurement | Zimbabwean | Immigrants from Sudan |
| Minimum | 25.7% | 10.0% |
| Maximum | 84.6% | 76.0% |
| Range | 58.9% | 66.0% |
| Mean | 51.5% | 41.7% |
| Median | 49.5% | 42.1% |
| Interquartile 25% (IQ1) | 43.8% | 34.9% |
| Interquartile 75% (IQ3) | 59.8% | 47.3% |
| Interquartile Range (IQR) | 16.0% | 12.4% |
| Standard Deviation (Sample) | 12.8% | 10.9% |
| Standard Deviation (Population) | 12.6% | 10.8% |
Similar Demographics by Married-couple Households
Demographics Similar to Zimbabweans by Married-couple Households
In terms of married-couple households, the demographic groups most similar to Zimbabweans are Immigrants from Venezuela (47.4%, a difference of 0.010%), Australian (47.4%, a difference of 0.020%), Pakistani (47.3%, a difference of 0.050%), Okinawan (47.4%, a difference of 0.090%), and Celtic (47.3%, a difference of 0.10%).
| Demographics | Rating | Rank | Married-couple Households |
| French Canadians | 92.4 /100 | #117 | Exceptional 47.5% |
| Immigrants | Germany | 92.4 /100 | #118 | Exceptional 47.5% |
| Chileans | 92.2 /100 | #119 | Exceptional 47.5% |
| Puget Sound Salish | 90.5 /100 | #120 | Exceptional 47.4% |
| Immigrants | Eastern Europe | 90.3 /100 | #121 | Exceptional 47.4% |
| Okinawans | 90.1 /100 | #122 | Exceptional 47.4% |
| Immigrants | Venezuela | 89.3 /100 | #123 | Excellent 47.4% |
| Zimbabweans | 89.2 /100 | #124 | Excellent 47.4% |
| Australians | 89.0 /100 | #125 | Excellent 47.4% |
| Pakistanis | 88.6 /100 | #126 | Excellent 47.3% |
| Celtics | 88.1 /100 | #127 | Excellent 47.3% |
| Immigrants | Peru | 87.9 /100 | #128 | Excellent 47.3% |
| Immigrants | Iraq | 87.8 /100 | #129 | Excellent 47.3% |
| Immigrants | Hungary | 87.8 /100 | #130 | Excellent 47.3% |
| Immigrants | Denmark | 87.5 /100 | #131 | Excellent 47.3% |
Demographics Similar to Immigrants from Sudan by Married-couple Households
In terms of married-couple households, the demographic groups most similar to Immigrants from Sudan are Menominee (42.0%, a difference of 0.11%), Immigrants from Yemen (42.0%, a difference of 0.11%), Kiowa (42.0%, a difference of 0.11%), Indonesian (42.0%, a difference of 0.22%), and Paiute (42.1%, a difference of 0.27%).
| Demographics | Rating | Rank | Married-couple Households |
| Sudanese | 0.0 /100 | #289 | Tragic 42.1% |
| Hondurans | 0.0 /100 | #290 | Tragic 42.1% |
| Paiute | 0.0 /100 | #291 | Tragic 42.1% |
| Indonesians | 0.0 /100 | #292 | Tragic 42.0% |
| Menominee | 0.0 /100 | #293 | Tragic 42.0% |
| Immigrants | Yemen | 0.0 /100 | #294 | Tragic 42.0% |
| Kiowa | 0.0 /100 | #295 | Tragic 42.0% |
| Immigrants | Sudan | 0.0 /100 | #296 | Tragic 41.9% |
| Arapaho | 0.0 /100 | #297 | Tragic 41.8% |
| Immigrants | Middle Africa | 0.0 /100 | #298 | Tragic 41.8% |
| Immigrants | Ghana | 0.0 /100 | #299 | Tragic 41.8% |
| Immigrants | Belize | 0.0 /100 | #300 | Tragic 41.8% |
| Immigrants | Bahamas | 0.0 /100 | #301 | Tragic 41.7% |
| Immigrants | Honduras | 0.0 /100 | #302 | Tragic 41.6% |
| Sub-Saharan Africans | 0.0 /100 | #303 | Tragic 41.6% |