Moroccan vs Immigrants from Sudan Receiving Food Stamps
COMPARE
Moroccan
Immigrants from Sudan
Receiving Food Stamps
Receiving Food Stamps Comparison
Moroccans
Immigrants from Sudan
12.8%
RECEIVING FOOD STAMPS
7.6/ 100
METRIC RATING
213th/ 347
METRIC RANK
12.1%
RECEIVING FOOD STAMPS
27.1/ 100
METRIC RATING
194th/ 347
METRIC RANK
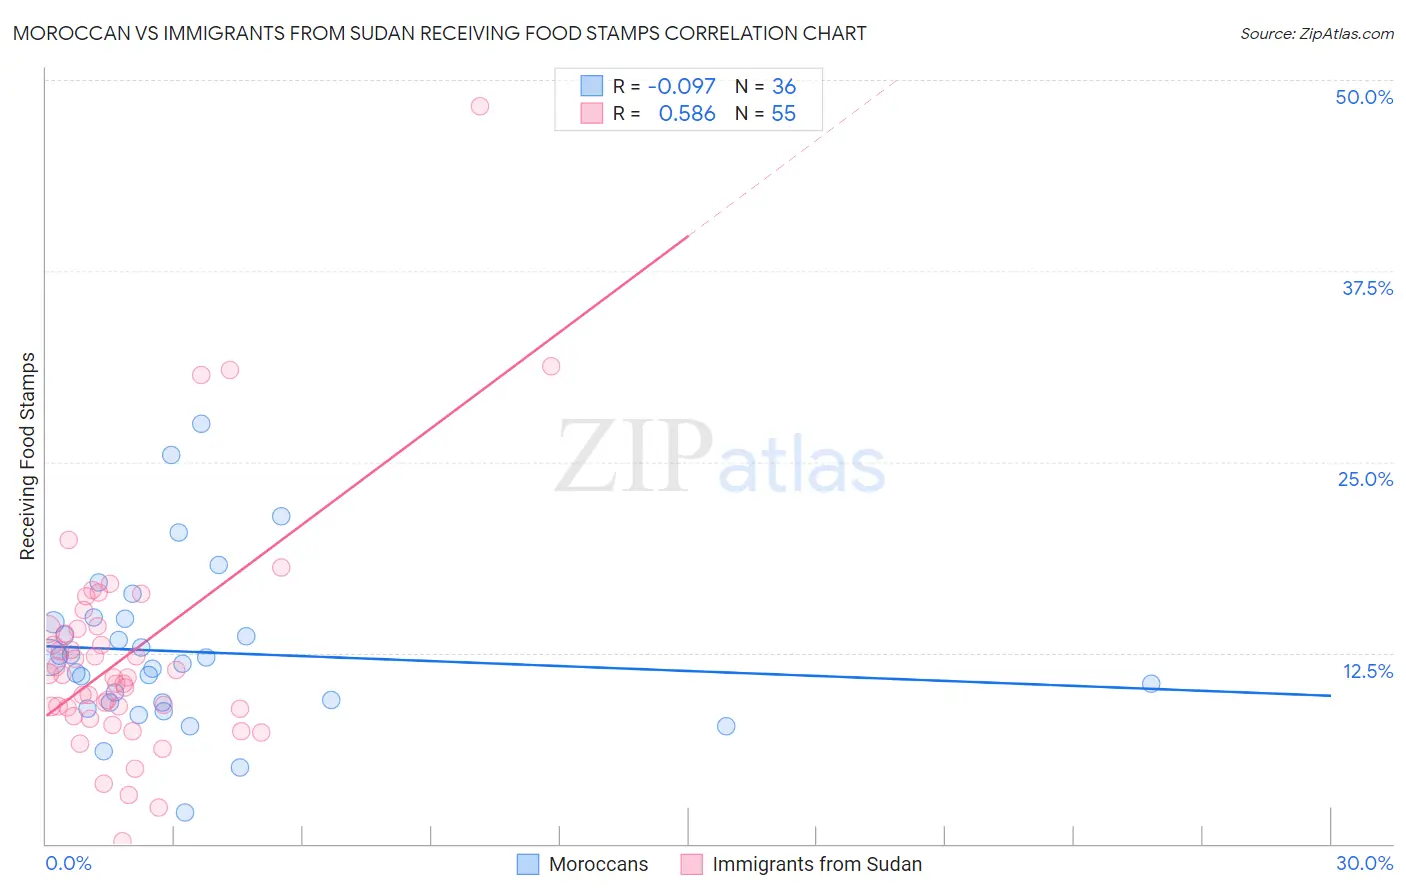
Moroccan vs Immigrants from Sudan Receiving Food Stamps Correlation Chart
The statistical analysis conducted on geographies consisting of 201,594,940 people shows a slight negative correlation between the proportion of Moroccans and percentage of population receiving government assistance and/or food stamps in the United States with a correlation coefficient (R) of -0.097 and weighted average of 12.8%. Similarly, the statistical analysis conducted on geographies consisting of 118,933,467 people shows a substantial positive correlation between the proportion of Immigrants from Sudan and percentage of population receiving government assistance and/or food stamps in the United States with a correlation coefficient (R) of 0.586 and weighted average of 12.1%, a difference of 5.1%.
Receiving Food Stamps Correlation Summary
| Measurement | Moroccan | Immigrants from Sudan |
| Minimum | 2.1% | 0.20% |
| Maximum | 27.5% | 48.3% |
| Range | 25.4% | 48.1% |
| Mean | 12.6% | 12.5% |
| Median | 12.0% | 10.9% |
| Interquartile 25% (IQ1) | 9.2% | 8.8% |
| Interquartile 75% (IQ3) | 14.6% | 14.1% |
| Interquartile Range (IQR) | 5.4% | 5.3% |
| Standard Deviation (Sample) | 5.3% | 7.8% |
| Standard Deviation (Population) | 5.2% | 7.8% |
Demographics Similar to Moroccans and Immigrants from Sudan by Receiving Food Stamps
In terms of receiving food stamps, the demographic groups most similar to Moroccans are Malaysian (12.7%, a difference of 0.40%), Colombian (12.6%, a difference of 1.0%), Immigrants from Uruguay (12.5%, a difference of 1.9%), Immigrants from Sierra Leone (12.5%, a difference of 1.9%), and Potawatomi (12.5%, a difference of 2.4%). Similarly, the demographic groups most similar to Immigrants from Sudan are American (12.2%, a difference of 0.060%), Iraqi (12.2%, a difference of 0.090%), Immigrants from Fiji (12.1%, a difference of 0.12%), Delaware (12.2%, a difference of 0.17%), and Immigrants from Costa Rica (12.2%, a difference of 0.30%).
| Demographics | Rating | Rank | Receiving Food Stamps |
| Immigrants | Fiji | 27.8 /100 | #193 | Fair 12.1% |
| Immigrants | Sudan | 27.1 /100 | #194 | Fair 12.1% |
| Americans | 26.7 /100 | #195 | Fair 12.2% |
| Iraqis | 26.6 /100 | #196 | Fair 12.2% |
| Delaware | 26.1 /100 | #197 | Fair 12.2% |
| Immigrants | Costa Rica | 25.4 /100 | #198 | Fair 12.2% |
| Portuguese | 25.1 /100 | #199 | Fair 12.2% |
| Sierra Leoneans | 23.6 /100 | #200 | Fair 12.2% |
| Ugandans | 22.5 /100 | #201 | Fair 12.2% |
| Immigrants | Venezuela | 20.1 /100 | #202 | Fair 12.3% |
| Shoshone | 17.7 /100 | #203 | Poor 12.4% |
| Immigrants | Nonimmigrants | 17.6 /100 | #204 | Poor 12.4% |
| Aleuts | 17.3 /100 | #205 | Poor 12.4% |
| Immigrants | Thailand | 17.0 /100 | #206 | Poor 12.4% |
| South Americans | 16.0 /100 | #207 | Poor 12.4% |
| Potawatomi | 14.6 /100 | #208 | Poor 12.5% |
| Immigrants | Sierra Leone | 12.9 /100 | #209 | Poor 12.5% |
| Immigrants | Uruguay | 12.8 /100 | #210 | Poor 12.5% |
| Colombians | 10.2 /100 | #211 | Poor 12.6% |
| Malaysians | 8.5 /100 | #212 | Tragic 12.7% |
| Moroccans | 7.6 /100 | #213 | Tragic 12.8% |