Lithuanian vs Immigrants from Caribbean Married-couple Households
COMPARE
Lithuanian
Immigrants from Caribbean
Married-couple Households
Married-couple Households Comparison
Lithuanians
Immigrants from Caribbean
48.9%
MARRIED-COUPLE HOUSEHOLDS
99.6/ 100
METRIC RATING
39th/ 347
METRIC RANK
40.8%
MARRIED-COUPLE HOUSEHOLDS
0.0/ 100
METRIC RATING
316th/ 347
METRIC RANK
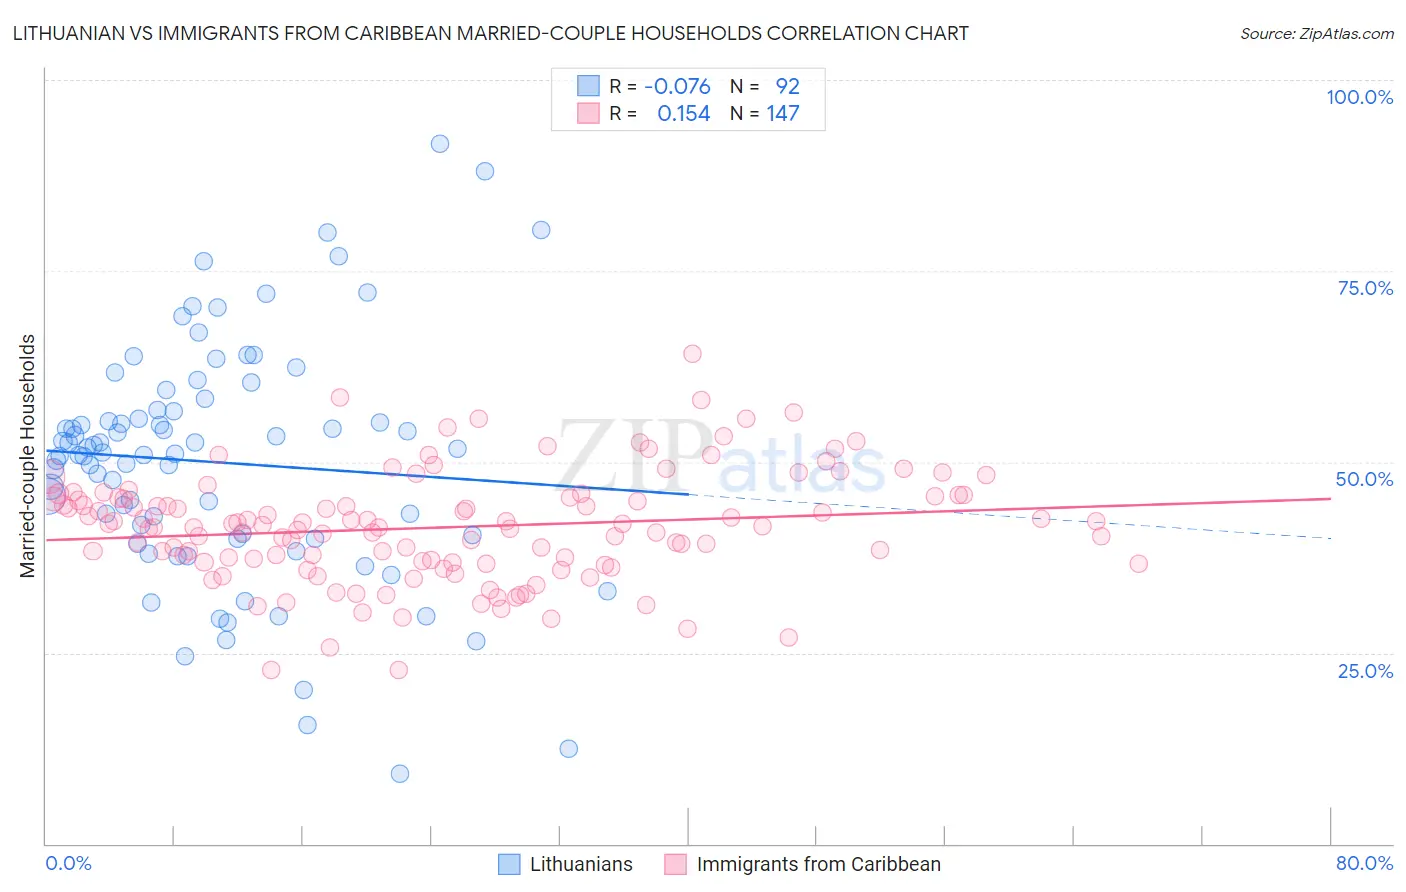
Lithuanian vs Immigrants from Caribbean Married-couple Households Correlation Chart
The statistical analysis conducted on geographies consisting of 421,720,983 people shows a slight negative correlation between the proportion of Lithuanians and percentage of married-couple family households in the United States with a correlation coefficient (R) of -0.076 and weighted average of 48.9%. Similarly, the statistical analysis conducted on geographies consisting of 449,664,871 people shows a poor positive correlation between the proportion of Immigrants from Caribbean and percentage of married-couple family households in the United States with a correlation coefficient (R) of 0.154 and weighted average of 40.8%, a difference of 19.9%.
Married-couple Households Correlation Summary
| Measurement | Lithuanian | Immigrants from Caribbean |
| Minimum | 9.2% | 22.8% |
| Maximum | 91.7% | 64.2% |
| Range | 82.5% | 41.4% |
| Mean | 49.9% | 41.4% |
| Median | 51.1% | 41.7% |
| Interquartile 25% (IQ1) | 40.2% | 36.8% |
| Interquartile 75% (IQ3) | 56.7% | 45.4% |
| Interquartile Range (IQR) | 16.5% | 8.5% |
| Standard Deviation (Sample) | 15.6% | 7.2% |
| Standard Deviation (Population) | 15.5% | 7.1% |
Similar Demographics by Married-couple Households
Demographics Similar to Lithuanians by Married-couple Households
In terms of married-couple households, the demographic groups most similar to Lithuanians are Immigrants from Bolivia (48.9%, a difference of 0.010%), Immigrants from Lebanon (48.9%, a difference of 0.050%), Greek (48.9%, a difference of 0.080%), Immigrants from Vietnam (48.8%, a difference of 0.090%), and Immigrants from Iran (48.8%, a difference of 0.15%).
| Demographics | Rating | Rank | Married-couple Households |
| Hungarians | 99.8 /100 | #32 | Exceptional 49.1% |
| Immigrants | Asia | 99.7 /100 | #33 | Exceptional 49.1% |
| Italians | 99.7 /100 | #34 | Exceptional 49.0% |
| Scottish | 99.7 /100 | #35 | Exceptional 49.0% |
| Iranians | 99.7 /100 | #36 | Exceptional 49.0% |
| Sri Lankans | 99.7 /100 | #37 | Exceptional 49.0% |
| Greeks | 99.7 /100 | #38 | Exceptional 48.9% |
| Lithuanians | 99.6 /100 | #39 | Exceptional 48.9% |
| Immigrants | Bolivia | 99.6 /100 | #40 | Exceptional 48.9% |
| Immigrants | Lebanon | 99.6 /100 | #41 | Exceptional 48.9% |
| Immigrants | Vietnam | 99.6 /100 | #42 | Exceptional 48.8% |
| Immigrants | Iran | 99.6 /100 | #43 | Exceptional 48.8% |
| Welsh | 99.5 /100 | #44 | Exceptional 48.8% |
| Immigrants | Eastern Asia | 99.5 /100 | #45 | Exceptional 48.8% |
| Tsimshian | 99.5 /100 | #46 | Exceptional 48.7% |
Demographics Similar to Immigrants from Caribbean by Married-couple Households
In terms of married-couple households, the demographic groups most similar to Immigrants from Caribbean are Trinidadian and Tobagonian (40.9%, a difference of 0.18%), Jamaican (40.9%, a difference of 0.26%), Immigrants from Jamaica (40.7%, a difference of 0.29%), Liberian (40.7%, a difference of 0.30%), and Immigrants from Haiti (40.9%, a difference of 0.34%).
| Demographics | Rating | Rank | Married-couple Households |
| Immigrants | Trinidad and Tobago | 0.0 /100 | #309 | Tragic 41.2% |
| Haitians | 0.0 /100 | #310 | Tragic 41.2% |
| Colville | 0.0 /100 | #311 | Tragic 41.0% |
| Africans | 0.0 /100 | #312 | Tragic 40.9% |
| Immigrants | Haiti | 0.0 /100 | #313 | Tragic 40.9% |
| Jamaicans | 0.0 /100 | #314 | Tragic 40.9% |
| Trinidadians and Tobagonians | 0.0 /100 | #315 | Tragic 40.9% |
| Immigrants | Caribbean | 0.0 /100 | #316 | Tragic 40.8% |
| Immigrants | Jamaica | 0.0 /100 | #317 | Tragic 40.7% |
| Liberians | 0.0 /100 | #318 | Tragic 40.7% |
| Bahamians | 0.0 /100 | #319 | Tragic 40.5% |
| West Indians | 0.0 /100 | #320 | Tragic 40.3% |
| Immigrants | Liberia | 0.0 /100 | #321 | Tragic 40.3% |
| Immigrants | Zaire | 0.0 /100 | #322 | Tragic 40.1% |
| Puerto Ricans | 0.0 /100 | #323 | Tragic 40.1% |