Kiowa vs Czech Family Households with Children
COMPARE
Kiowa
Czech
Family Households with Children
Family Households with Children Comparison
Kiowa
Czechs
27.3%
FAMILY HOUSEHOLDS WITH CHILDREN
22.2/ 100
METRIC RATING
203rd/ 347
METRIC RANK
27.5%
FAMILY HOUSEHOLDS WITH CHILDREN
65.3/ 100
METRIC RATING
163rd/ 347
METRIC RANK
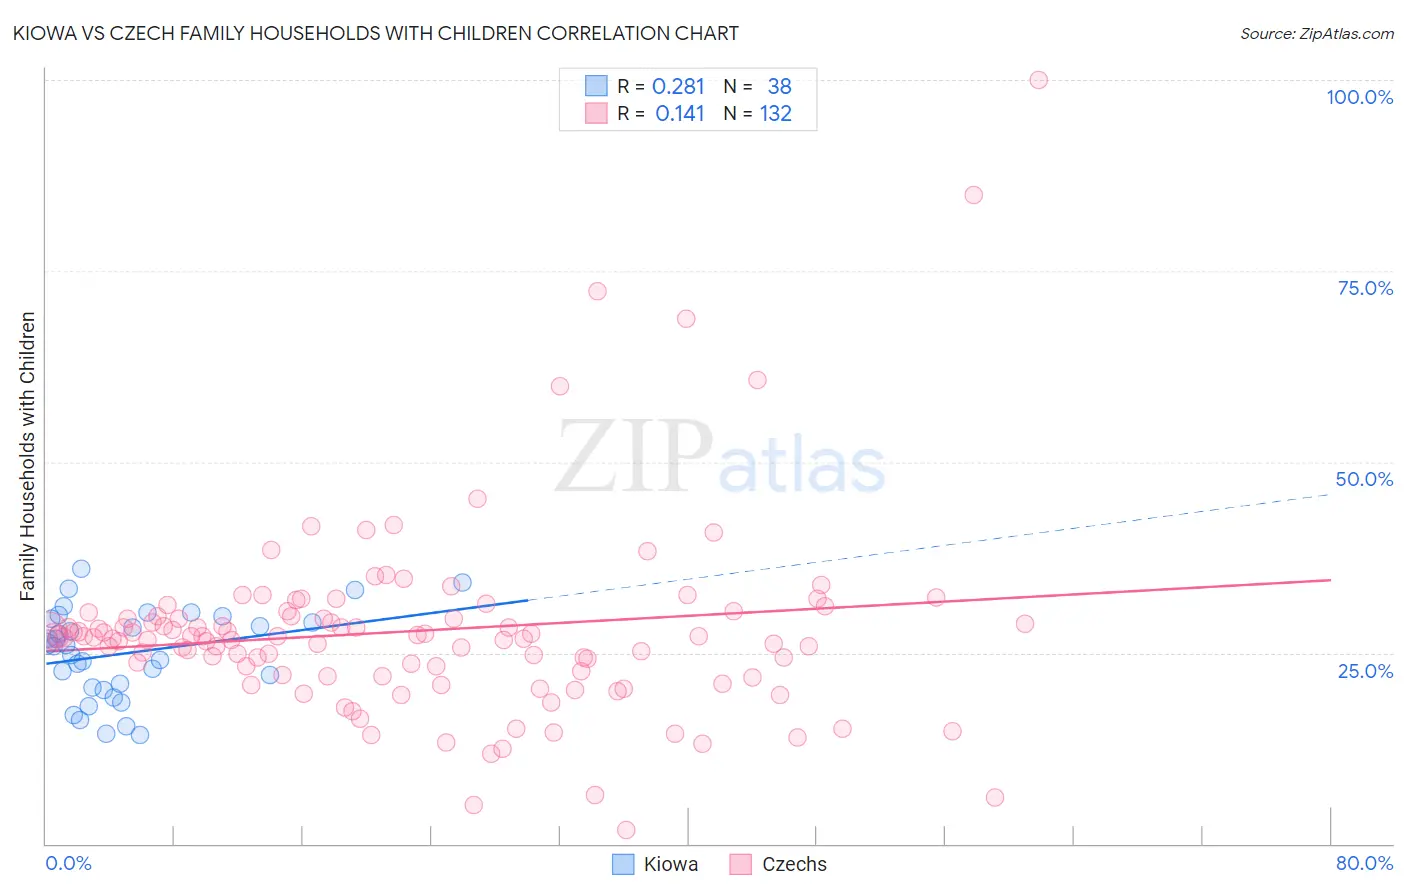
Kiowa vs Czech Family Households with Children Correlation Chart
The statistical analysis conducted on geographies consisting of 56,098,282 people shows a weak positive correlation between the proportion of Kiowa and percentage of family households with children in the United States with a correlation coefficient (R) of 0.281 and weighted average of 27.3%. Similarly, the statistical analysis conducted on geographies consisting of 484,223,997 people shows a poor positive correlation between the proportion of Czechs and percentage of family households with children in the United States with a correlation coefficient (R) of 0.141 and weighted average of 27.5%, a difference of 1.0%.
Family Households with Children Correlation Summary
| Measurement | Kiowa | Czech |
| Minimum | 14.3% | 1.9% |
| Maximum | 35.9% | 100.0% |
| Range | 21.7% | 98.1% |
| Mean | 25.0% | 27.9% |
| Median | 26.0% | 27.1% |
| Interquartile 25% (IQ1) | 20.5% | 22.3% |
| Interquartile 75% (IQ3) | 29.5% | 29.8% |
| Interquartile Range (IQR) | 9.0% | 7.4% |
| Standard Deviation (Sample) | 5.8% | 12.9% |
| Standard Deviation (Population) | 5.7% | 12.8% |
Similar Demographics by Family Households with Children
Demographics Similar to Kiowa by Family Households with Children
In terms of family households with children, the demographic groups most similar to Kiowa are American (27.3%, a difference of 0.020%), Immigrants from Sudan (27.3%, a difference of 0.020%), Immigrants from Haiti (27.2%, a difference of 0.070%), Immigrants from Micronesia (27.2%, a difference of 0.070%), and Haitian (27.2%, a difference of 0.080%).
| Demographics | Rating | Rank | Family Households with Children |
| Cheyenne | 35.1 /100 | #196 | Fair 27.4% |
| Norwegians | 35.0 /100 | #197 | Fair 27.4% |
| Immigrants | Romania | 34.4 /100 | #198 | Fair 27.4% |
| English | 32.0 /100 | #199 | Fair 27.3% |
| Immigrants | Congo | 28.7 /100 | #200 | Fair 27.3% |
| Bhutanese | 25.1 /100 | #201 | Fair 27.3% |
| Americans | 22.8 /100 | #202 | Fair 27.3% |
| Kiowa | 22.2 /100 | #203 | Fair 27.3% |
| Immigrants | Sudan | 21.6 /100 | #204 | Fair 27.3% |
| Immigrants | Haiti | 20.3 /100 | #205 | Fair 27.2% |
| Immigrants | Micronesia | 20.2 /100 | #206 | Fair 27.2% |
| Haitians | 19.8 /100 | #207 | Poor 27.2% |
| Immigrants | Poland | 16.4 /100 | #208 | Poor 27.2% |
| Dutch West Indians | 15.8 /100 | #209 | Poor 27.2% |
| Immigrants | Ukraine | 14.4 /100 | #210 | Poor 27.2% |
Demographics Similar to Czechs by Family Households with Children
In terms of family households with children, the demographic groups most similar to Czechs are Immigrants from Hong Kong (27.5%, a difference of 0.010%), Alaskan Athabascan (27.6%, a difference of 0.040%), Immigrants from Bangladesh (27.6%, a difference of 0.040%), Subsaharan African (27.6%, a difference of 0.050%), and Immigrants from South Africa (27.5%, a difference of 0.090%).
| Demographics | Rating | Rank | Family Households with Children |
| Hungarians | 74.6 /100 | #156 | Good 27.6% |
| Indians (Asian) | 71.6 /100 | #157 | Good 27.6% |
| Romanians | 70.8 /100 | #158 | Good 27.6% |
| Mongolians | 70.7 /100 | #159 | Good 27.6% |
| Sub-Saharan Africans | 67.5 /100 | #160 | Good 27.6% |
| Alaskan Athabascans | 67.1 /100 | #161 | Good 27.6% |
| Immigrants | Bangladesh | 67.0 /100 | #162 | Good 27.6% |
| Czechs | 65.3 /100 | #163 | Good 27.5% |
| Immigrants | Hong Kong | 64.9 /100 | #164 | Good 27.5% |
| Immigrants | South Africa | 61.3 /100 | #165 | Good 27.5% |
| Immigrants | Nonimmigrants | 61.2 /100 | #166 | Good 27.5% |
| Dominicans | 61.1 /100 | #167 | Good 27.5% |
| Immigrants | Kuwait | 60.9 /100 | #168 | Good 27.5% |
| Seminole | 56.9 /100 | #169 | Average 27.5% |
| Cherokee | 56.7 /100 | #170 | Average 27.5% |