African vs Czech Family Households with Children
COMPARE
African
Czech
Family Households with Children
Family Households with Children Comparison
Africans
Czechs
27.2%
FAMILY HOUSEHOLDS WITH CHILDREN
13.0/ 100
METRIC RATING
214th/ 347
METRIC RANK
27.5%
FAMILY HOUSEHOLDS WITH CHILDREN
65.3/ 100
METRIC RATING
163rd/ 347
METRIC RANK
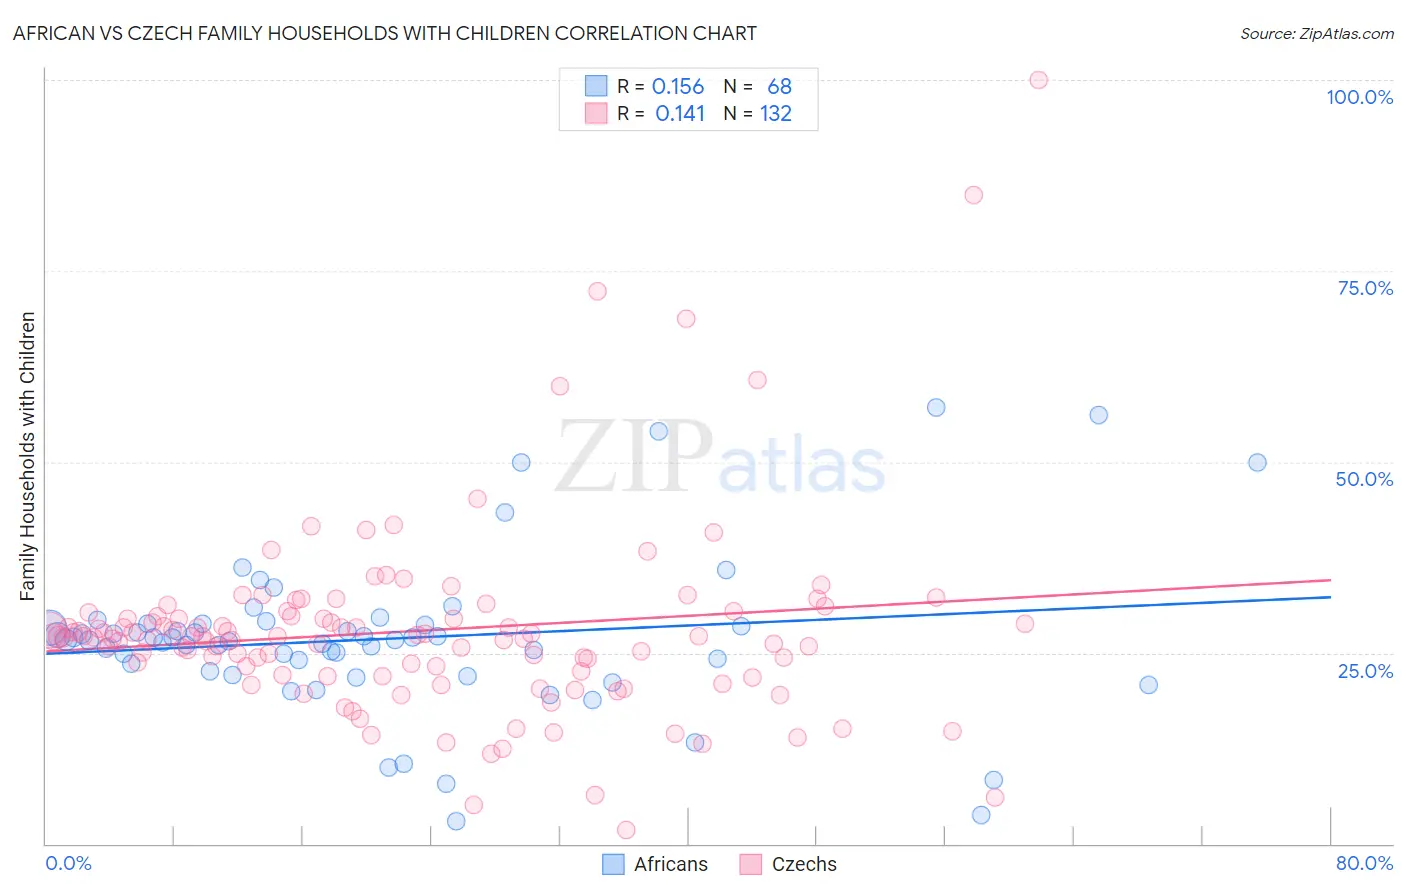
African vs Czech Family Households with Children Correlation Chart
The statistical analysis conducted on geographies consisting of 469,417,507 people shows a poor positive correlation between the proportion of Africans and percentage of family households with children in the United States with a correlation coefficient (R) of 0.156 and weighted average of 27.2%. Similarly, the statistical analysis conducted on geographies consisting of 484,223,997 people shows a poor positive correlation between the proportion of Czechs and percentage of family households with children in the United States with a correlation coefficient (R) of 0.141 and weighted average of 27.5%, a difference of 1.4%.
Family Households with Children Correlation Summary
| Measurement | African | Czech |
| Minimum | 3.0% | 1.9% |
| Maximum | 57.1% | 100.0% |
| Range | 54.2% | 98.1% |
| Mean | 26.8% | 27.9% |
| Median | 26.7% | 27.1% |
| Interquartile 25% (IQ1) | 23.1% | 22.3% |
| Interquartile 75% (IQ3) | 28.7% | 29.8% |
| Interquartile Range (IQR) | 5.6% | 7.4% |
| Standard Deviation (Sample) | 10.3% | 12.9% |
| Standard Deviation (Population) | 10.3% | 12.8% |
Similar Demographics by Family Households with Children
Demographics Similar to Africans by Family Households with Children
In terms of family households with children, the demographic groups most similar to Africans are Northern European (27.2%, a difference of 0.010%), Immigrants from Dominica (27.2%, a difference of 0.040%), Okinawan (27.2%, a difference of 0.040%), Cuban (27.1%, a difference of 0.040%), and U.S. Virgin Islander (27.1%, a difference of 0.040%).
| Demographics | Rating | Rank | Family Households with Children |
| Haitians | 19.8 /100 | #207 | Poor 27.2% |
| Immigrants | Poland | 16.4 /100 | #208 | Poor 27.2% |
| Dutch West Indians | 15.8 /100 | #209 | Poor 27.2% |
| Immigrants | Ukraine | 14.4 /100 | #210 | Poor 27.2% |
| Welsh | 14.2 /100 | #211 | Poor 27.2% |
| Immigrants | Dominica | 13.9 /100 | #212 | Poor 27.2% |
| Okinawans | 13.7 /100 | #213 | Poor 27.2% |
| Africans | 13.0 /100 | #214 | Poor 27.2% |
| Northern Europeans | 12.8 /100 | #215 | Poor 27.2% |
| Cubans | 12.2 /100 | #216 | Poor 27.1% |
| U.S. Virgin Islanders | 12.1 /100 | #217 | Poor 27.1% |
| Greeks | 11.4 /100 | #218 | Poor 27.1% |
| Immigrants | Japan | 10.7 /100 | #219 | Poor 27.1% |
| Austrians | 9.9 /100 | #220 | Tragic 27.1% |
| New Zealanders | 9.6 /100 | #221 | Tragic 27.1% |
Demographics Similar to Czechs by Family Households with Children
In terms of family households with children, the demographic groups most similar to Czechs are Immigrants from Hong Kong (27.5%, a difference of 0.010%), Alaskan Athabascan (27.6%, a difference of 0.040%), Immigrants from Bangladesh (27.6%, a difference of 0.040%), Subsaharan African (27.6%, a difference of 0.050%), and Immigrants from South Africa (27.5%, a difference of 0.090%).
| Demographics | Rating | Rank | Family Households with Children |
| Hungarians | 74.6 /100 | #156 | Good 27.6% |
| Indians (Asian) | 71.6 /100 | #157 | Good 27.6% |
| Romanians | 70.8 /100 | #158 | Good 27.6% |
| Mongolians | 70.7 /100 | #159 | Good 27.6% |
| Sub-Saharan Africans | 67.5 /100 | #160 | Good 27.6% |
| Alaskan Athabascans | 67.1 /100 | #161 | Good 27.6% |
| Immigrants | Bangladesh | 67.0 /100 | #162 | Good 27.6% |
| Czechs | 65.3 /100 | #163 | Good 27.5% |
| Immigrants | Hong Kong | 64.9 /100 | #164 | Good 27.5% |
| Immigrants | South Africa | 61.3 /100 | #165 | Good 27.5% |
| Immigrants | Nonimmigrants | 61.2 /100 | #166 | Good 27.5% |
| Dominicans | 61.1 /100 | #167 | Good 27.5% |
| Immigrants | Kuwait | 60.9 /100 | #168 | Good 27.5% |
| Seminole | 56.9 /100 | #169 | Average 27.5% |
| Cherokee | 56.7 /100 | #170 | Average 27.5% |