Israeli vs Immigrants from Germany Family Households
COMPARE
Israeli
Immigrants from Germany
Family Households
Family Households Comparison
Israelis
Immigrants from Germany
63.1%
FAMILY HOUSEHOLDS
0.4/ 100
METRIC RATING
267th/ 347
METRIC RANK
64.3%
FAMILY HOUSEHOLDS
50.0/ 100
METRIC RATING
174th/ 347
METRIC RANK
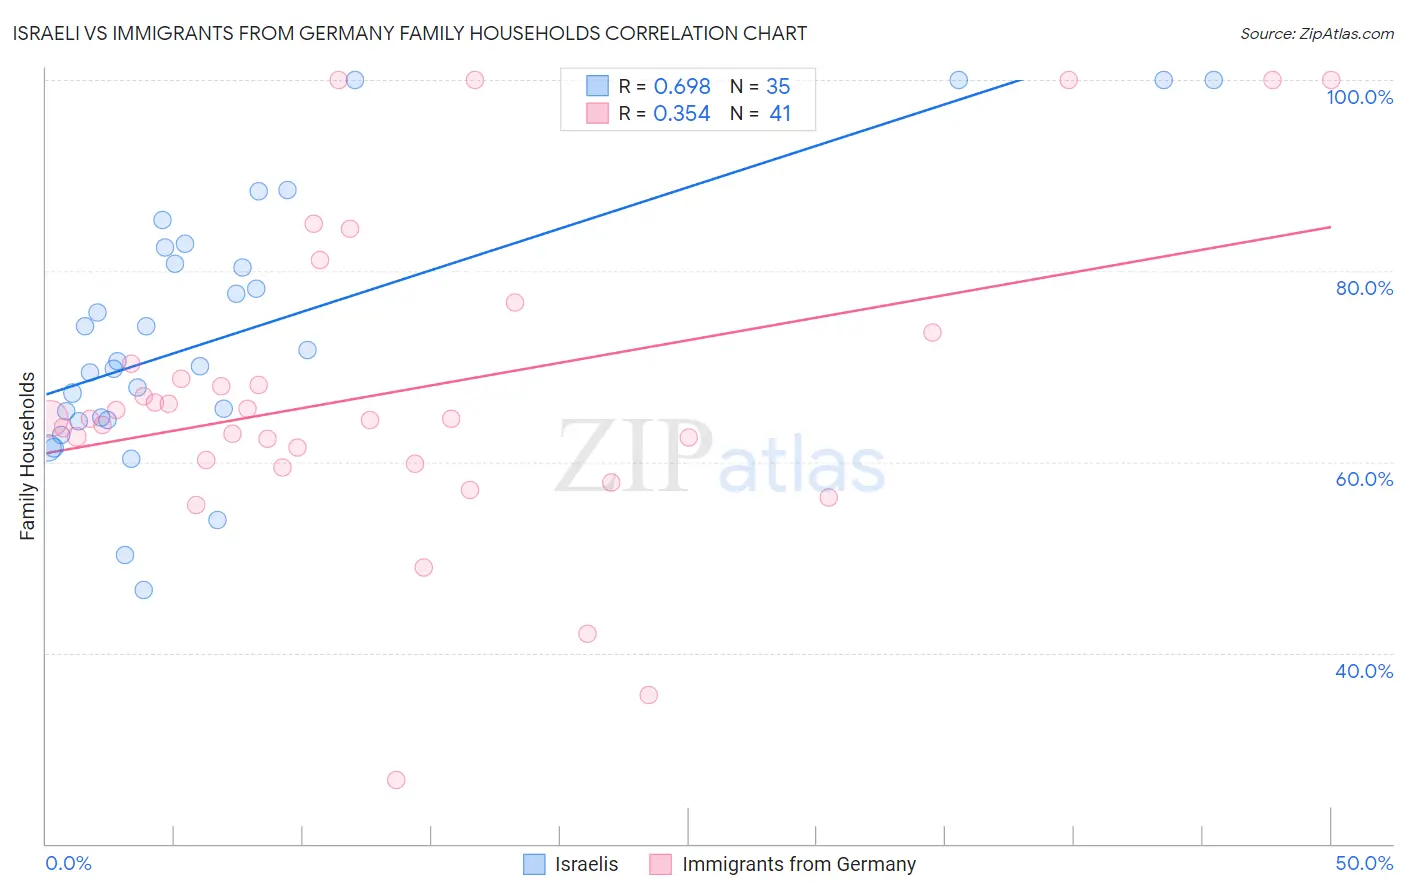
Israeli vs Immigrants from Germany Family Households Correlation Chart
The statistical analysis conducted on geographies consisting of 210,999,520 people shows a significant positive correlation between the proportion of Israelis and percentage of family households in the United States with a correlation coefficient (R) of 0.698 and weighted average of 63.1%. Similarly, the statistical analysis conducted on geographies consisting of 463,759,917 people shows a mild positive correlation between the proportion of Immigrants from Germany and percentage of family households in the United States with a correlation coefficient (R) of 0.354 and weighted average of 64.3%, a difference of 1.9%.
Family Households Correlation Summary
| Measurement | Israeli | Immigrants from Germany |
| Minimum | 46.6% | 26.7% |
| Maximum | 100.0% | 100.0% |
| Range | 53.4% | 73.3% |
| Mean | 73.6% | 67.4% |
| Median | 70.5% | 64.5% |
| Interquartile 25% (IQ1) | 64.4% | 60.0% |
| Interquartile 75% (IQ3) | 82.5% | 71.9% |
| Interquartile Range (IQR) | 18.1% | 11.9% |
| Standard Deviation (Sample) | 13.8% | 16.4% |
| Standard Deviation (Population) | 13.6% | 16.2% |
Similar Demographics by Family Households
Demographics Similar to Israelis by Family Households
In terms of family households, the demographic groups most similar to Israelis are Immigrants from Western Africa (63.1%, a difference of 0.040%), Colville (63.2%, a difference of 0.050%), Immigrants from Singapore (63.1%, a difference of 0.050%), Cheyenne (63.2%, a difference of 0.060%), and Kenyan (63.2%, a difference of 0.060%).
| Demographics | Rating | Rank | Family Households |
| Cypriots | 0.6 /100 | #260 | Tragic 63.2% |
| Immigrants | Russia | 0.6 /100 | #261 | Tragic 63.2% |
| Immigrants | Ireland | 0.6 /100 | #262 | Tragic 63.2% |
| Cheyenne | 0.5 /100 | #263 | Tragic 63.2% |
| Kenyans | 0.5 /100 | #264 | Tragic 63.2% |
| Colville | 0.5 /100 | #265 | Tragic 63.2% |
| Immigrants | Western Africa | 0.5 /100 | #266 | Tragic 63.1% |
| Israelis | 0.4 /100 | #267 | Tragic 63.1% |
| Immigrants | Singapore | 0.4 /100 | #268 | Tragic 63.1% |
| Yugoslavians | 0.4 /100 | #269 | Tragic 63.1% |
| Immigrants | Austria | 0.3 /100 | #270 | Tragic 63.1% |
| Immigrants | Croatia | 0.3 /100 | #271 | Tragic 63.1% |
| Immigrants | Turkey | 0.3 /100 | #272 | Tragic 63.1% |
| Immigrants | Kazakhstan | 0.3 /100 | #273 | Tragic 63.1% |
| Lumbee | 0.3 /100 | #274 | Tragic 63.1% |
Demographics Similar to Immigrants from Germany by Family Households
In terms of family households, the demographic groups most similar to Immigrants from Germany are Immigrants from Sierra Leone (64.3%, a difference of 0.030%), Dutch West Indian (64.3%, a difference of 0.050%), Ute (64.3%, a difference of 0.060%), Iraqi (64.4%, a difference of 0.080%), and Armenian (64.4%, a difference of 0.080%).
| Demographics | Rating | Rank | Family Households |
| Irish | 57.9 /100 | #167 | Average 64.4% |
| Hondurans | 57.5 /100 | #168 | Average 64.4% |
| Iraqis | 56.0 /100 | #169 | Average 64.4% |
| Armenians | 55.9 /100 | #170 | Average 64.4% |
| Ute | 54.6 /100 | #171 | Average 64.3% |
| Dutch West Indians | 53.9 /100 | #172 | Average 64.3% |
| Immigrants | Sierra Leone | 52.5 /100 | #173 | Average 64.3% |
| Immigrants | Germany | 50.0 /100 | #174 | Average 64.3% |
| Bangladeshis | 44.3 /100 | #175 | Average 64.3% |
| Vietnamese | 43.6 /100 | #176 | Average 64.2% |
| Immigrants | Micronesia | 42.3 /100 | #177 | Average 64.2% |
| Jamaicans | 40.6 /100 | #178 | Average 64.2% |
| Immigrants | Ukraine | 38.2 /100 | #179 | Fair 64.2% |
| Immigrants | Honduras | 35.0 /100 | #180 | Fair 64.2% |
| Immigrants | Trinidad and Tobago | 34.9 /100 | #181 | Fair 64.2% |