Israeli vs Immigrants from Poland Family Households
COMPARE
Israeli
Immigrants from Poland
Family Households
Family Households Comparison
Israelis
Immigrants from Poland
63.1%
FAMILY HOUSEHOLDS
0.4/ 100
METRIC RATING
267th/ 347
METRIC RANK
65.2%
FAMILY HOUSEHOLDS
98.7/ 100
METRIC RATING
94th/ 347
METRIC RANK
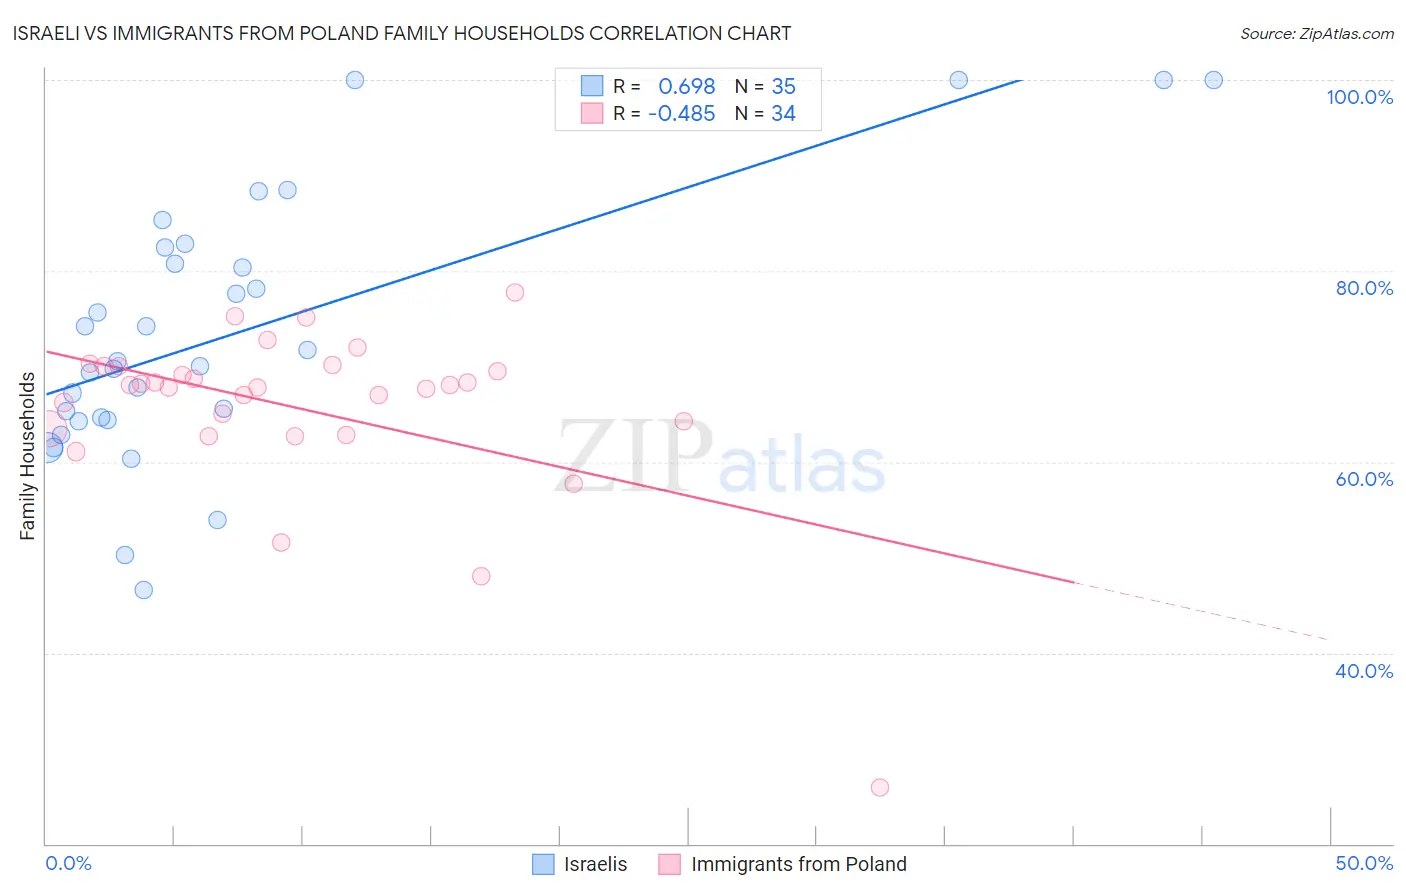
Israeli vs Immigrants from Poland Family Households Correlation Chart
The statistical analysis conducted on geographies consisting of 210,999,520 people shows a significant positive correlation between the proportion of Israelis and percentage of family households in the United States with a correlation coefficient (R) of 0.698 and weighted average of 63.1%. Similarly, the statistical analysis conducted on geographies consisting of 304,786,496 people shows a moderate negative correlation between the proportion of Immigrants from Poland and percentage of family households in the United States with a correlation coefficient (R) of -0.485 and weighted average of 65.2%, a difference of 3.4%.
Family Households Correlation Summary
| Measurement | Israeli | Immigrants from Poland |
| Minimum | 46.6% | 25.9% |
| Maximum | 100.0% | 77.7% |
| Range | 53.4% | 51.8% |
| Mean | 73.6% | 65.6% |
| Median | 70.5% | 67.9% |
| Interquartile 25% (IQ1) | 64.4% | 63.4% |
| Interquartile 75% (IQ3) | 82.5% | 70.0% |
| Interquartile Range (IQR) | 18.1% | 6.6% |
| Standard Deviation (Sample) | 13.8% | 9.2% |
| Standard Deviation (Population) | 13.6% | 9.0% |
Similar Demographics by Family Households
Demographics Similar to Israelis by Family Households
In terms of family households, the demographic groups most similar to Israelis are Immigrants from Western Africa (63.1%, a difference of 0.040%), Colville (63.2%, a difference of 0.050%), Immigrants from Singapore (63.1%, a difference of 0.050%), Cheyenne (63.2%, a difference of 0.060%), and Kenyan (63.2%, a difference of 0.060%).
| Demographics | Rating | Rank | Family Households |
| Cypriots | 0.6 /100 | #260 | Tragic 63.2% |
| Immigrants | Russia | 0.6 /100 | #261 | Tragic 63.2% |
| Immigrants | Ireland | 0.6 /100 | #262 | Tragic 63.2% |
| Cheyenne | 0.5 /100 | #263 | Tragic 63.2% |
| Kenyans | 0.5 /100 | #264 | Tragic 63.2% |
| Colville | 0.5 /100 | #265 | Tragic 63.2% |
| Immigrants | Western Africa | 0.5 /100 | #266 | Tragic 63.1% |
| Israelis | 0.4 /100 | #267 | Tragic 63.1% |
| Immigrants | Singapore | 0.4 /100 | #268 | Tragic 63.1% |
| Yugoslavians | 0.4 /100 | #269 | Tragic 63.1% |
| Immigrants | Austria | 0.3 /100 | #270 | Tragic 63.1% |
| Immigrants | Croatia | 0.3 /100 | #271 | Tragic 63.1% |
| Immigrants | Turkey | 0.3 /100 | #272 | Tragic 63.1% |
| Immigrants | Kazakhstan | 0.3 /100 | #273 | Tragic 63.1% |
| Lumbee | 0.3 /100 | #274 | Tragic 63.1% |
Demographics Similar to Immigrants from Poland by Family Households
In terms of family households, the demographic groups most similar to Immigrants from Poland are Hopi (65.3%, a difference of 0.020%), Guyanese (65.3%, a difference of 0.020%), Immigrants from Portugal (65.2%, a difference of 0.030%), Swiss (65.2%, a difference of 0.030%), and Guatemalan (65.2%, a difference of 0.030%).
| Demographics | Rating | Rank | Family Households |
| Immigrants | Egypt | 99.2 /100 | #87 | Exceptional 65.3% |
| Immigrants | Haiti | 99.1 /100 | #88 | Exceptional 65.3% |
| Immigrants | Caribbean | 99.1 /100 | #89 | Exceptional 65.3% |
| Immigrants | Laos | 99.1 /100 | #90 | Exceptional 65.3% |
| Crow | 98.9 /100 | #91 | Exceptional 65.3% |
| Hopi | 98.8 /100 | #92 | Exceptional 65.3% |
| Guyanese | 98.8 /100 | #93 | Exceptional 65.3% |
| Immigrants | Poland | 98.7 /100 | #94 | Exceptional 65.2% |
| Immigrants | Portugal | 98.6 /100 | #95 | Exceptional 65.2% |
| Swiss | 98.6 /100 | #96 | Exceptional 65.2% |
| Guatemalans | 98.6 /100 | #97 | Exceptional 65.2% |
| Immigrants | Syria | 98.4 /100 | #98 | Exceptional 65.2% |
| Central American Indians | 98.3 /100 | #99 | Exceptional 65.2% |
| Haitians | 98.1 /100 | #100 | Exceptional 65.2% |
| Chileans | 98.1 /100 | #101 | Exceptional 65.2% |