Chippewa vs Immigrants from Germany Family Households
COMPARE
Chippewa
Immigrants from Germany
Family Households
Family Households Comparison
Chippewa
Immigrants from Germany
62.1%
FAMILY HOUSEHOLDS
0.0/ 100
METRIC RATING
308th/ 347
METRIC RANK
64.3%
FAMILY HOUSEHOLDS
50.0/ 100
METRIC RATING
174th/ 347
METRIC RANK
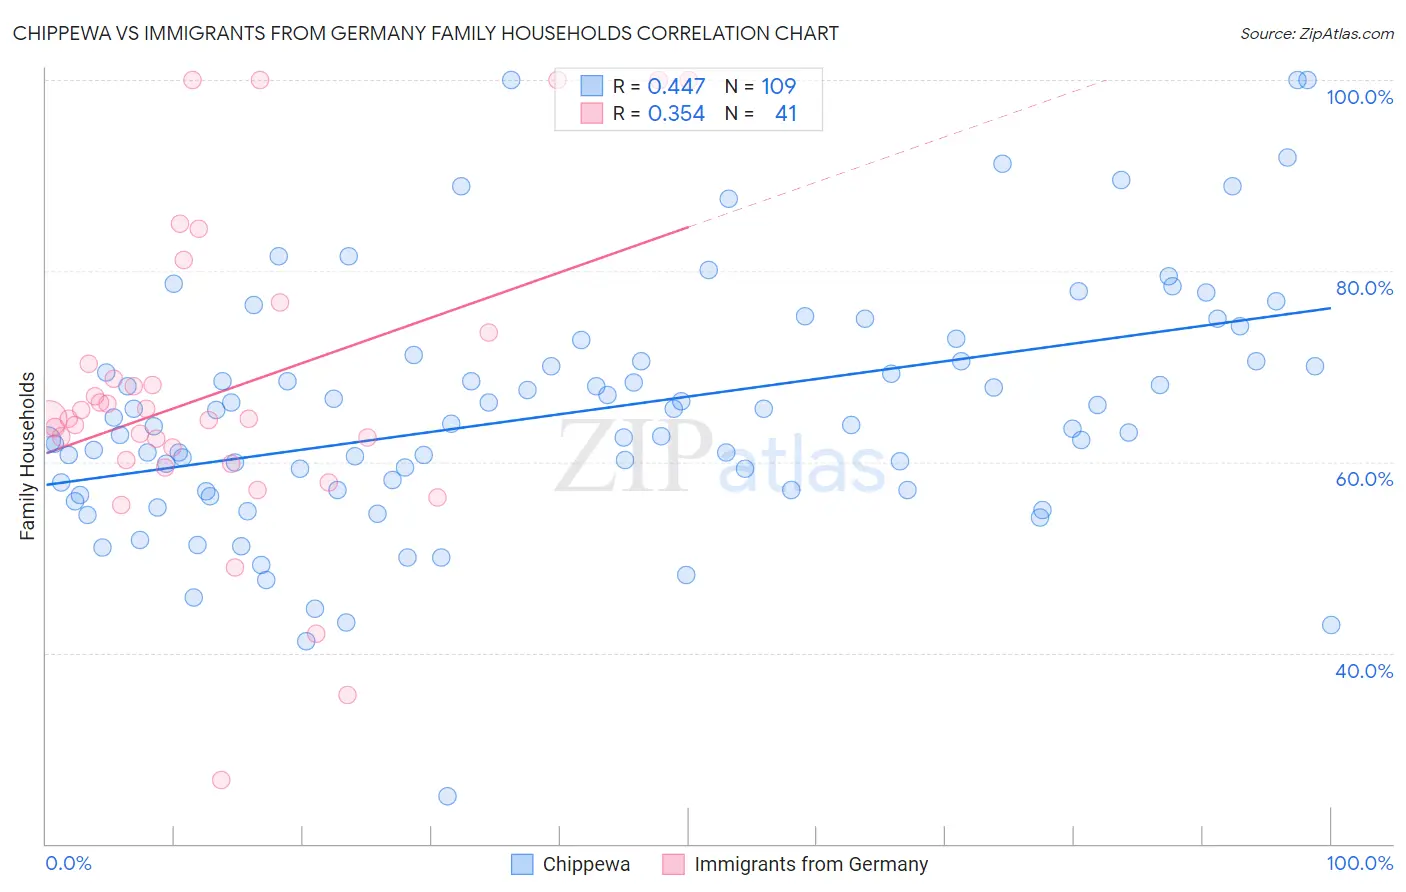
Chippewa vs Immigrants from Germany Family Households Correlation Chart
The statistical analysis conducted on geographies consisting of 215,001,181 people shows a moderate positive correlation between the proportion of Chippewa and percentage of family households in the United States with a correlation coefficient (R) of 0.447 and weighted average of 62.1%. Similarly, the statistical analysis conducted on geographies consisting of 463,759,917 people shows a mild positive correlation between the proportion of Immigrants from Germany and percentage of family households in the United States with a correlation coefficient (R) of 0.354 and weighted average of 64.3%, a difference of 3.6%.
Family Households Correlation Summary
| Measurement | Chippewa | Immigrants from Germany |
| Minimum | 25.0% | 26.7% |
| Maximum | 100.0% | 100.0% |
| Range | 75.0% | 73.3% |
| Mean | 65.2% | 67.4% |
| Median | 63.9% | 64.5% |
| Interquartile 25% (IQ1) | 57.0% | 60.0% |
| Interquartile 75% (IQ3) | 70.6% | 71.9% |
| Interquartile Range (IQR) | 13.5% | 11.9% |
| Standard Deviation (Sample) | 12.8% | 16.4% |
| Standard Deviation (Population) | 12.7% | 16.2% |
Similar Demographics by Family Households
Demographics Similar to Chippewa by Family Households
In terms of family households, the demographic groups most similar to Chippewa are Immigrants from Norway (62.1%, a difference of 0.0%), Subsaharan African (62.1%, a difference of 0.050%), African (62.1%, a difference of 0.080%), Bermudan (62.2%, a difference of 0.10%), and Immigrants from Liberia (62.0%, a difference of 0.10%).
| Demographics | Rating | Rank | Family Households |
| Immigrants | Albania | 0.0 /100 | #301 | Tragic 62.4% |
| Immigrants | Kenya | 0.0 /100 | #302 | Tragic 62.3% |
| Cree | 0.0 /100 | #303 | Tragic 62.3% |
| Iroquois | 0.0 /100 | #304 | Tragic 62.2% |
| Bermudans | 0.0 /100 | #305 | Tragic 62.2% |
| Africans | 0.0 /100 | #306 | Tragic 62.1% |
| Immigrants | Norway | 0.0 /100 | #307 | Tragic 62.1% |
| Chippewa | 0.0 /100 | #308 | Tragic 62.1% |
| Sub-Saharan Africans | 0.0 /100 | #309 | Tragic 62.1% |
| Immigrants | Liberia | 0.0 /100 | #310 | Tragic 62.0% |
| Immigrants | Morocco | 0.0 /100 | #311 | Tragic 62.0% |
| Immigrants | Latvia | 0.0 /100 | #312 | Tragic 62.0% |
| Liberians | 0.0 /100 | #313 | Tragic 62.0% |
| Immigrants | Cabo Verde | 0.0 /100 | #314 | Tragic 61.9% |
| Moroccans | 0.0 /100 | #315 | Tragic 61.9% |
Demographics Similar to Immigrants from Germany by Family Households
In terms of family households, the demographic groups most similar to Immigrants from Germany are Immigrants from Sierra Leone (64.3%, a difference of 0.030%), Dutch West Indian (64.3%, a difference of 0.050%), Ute (64.3%, a difference of 0.060%), Iraqi (64.4%, a difference of 0.080%), and Armenian (64.4%, a difference of 0.080%).
| Demographics | Rating | Rank | Family Households |
| Irish | 57.9 /100 | #167 | Average 64.4% |
| Hondurans | 57.5 /100 | #168 | Average 64.4% |
| Iraqis | 56.0 /100 | #169 | Average 64.4% |
| Armenians | 55.9 /100 | #170 | Average 64.4% |
| Ute | 54.6 /100 | #171 | Average 64.3% |
| Dutch West Indians | 53.9 /100 | #172 | Average 64.3% |
| Immigrants | Sierra Leone | 52.5 /100 | #173 | Average 64.3% |
| Immigrants | Germany | 50.0 /100 | #174 | Average 64.3% |
| Bangladeshis | 44.3 /100 | #175 | Average 64.3% |
| Vietnamese | 43.6 /100 | #176 | Average 64.2% |
| Immigrants | Micronesia | 42.3 /100 | #177 | Average 64.2% |
| Jamaicans | 40.6 /100 | #178 | Average 64.2% |
| Immigrants | Ukraine | 38.2 /100 | #179 | Fair 64.2% |
| Immigrants | Honduras | 35.0 /100 | #180 | Fair 64.2% |
| Immigrants | Trinidad and Tobago | 34.9 /100 | #181 | Fair 64.2% |