Somali vs Immigrants from Uruguay Married-couple Households
COMPARE
Somali
Immigrants from Uruguay
Married-couple Households
Married-couple Households Comparison
Somalis
Immigrants from Uruguay
39.0%
MARRIED-COUPLE HOUSEHOLDS
0.0/ 100
METRIC RATING
332nd/ 347
METRIC RANK
44.5%
MARRIED-COUPLE HOUSEHOLDS
1.1/ 100
METRIC RATING
238th/ 347
METRIC RANK
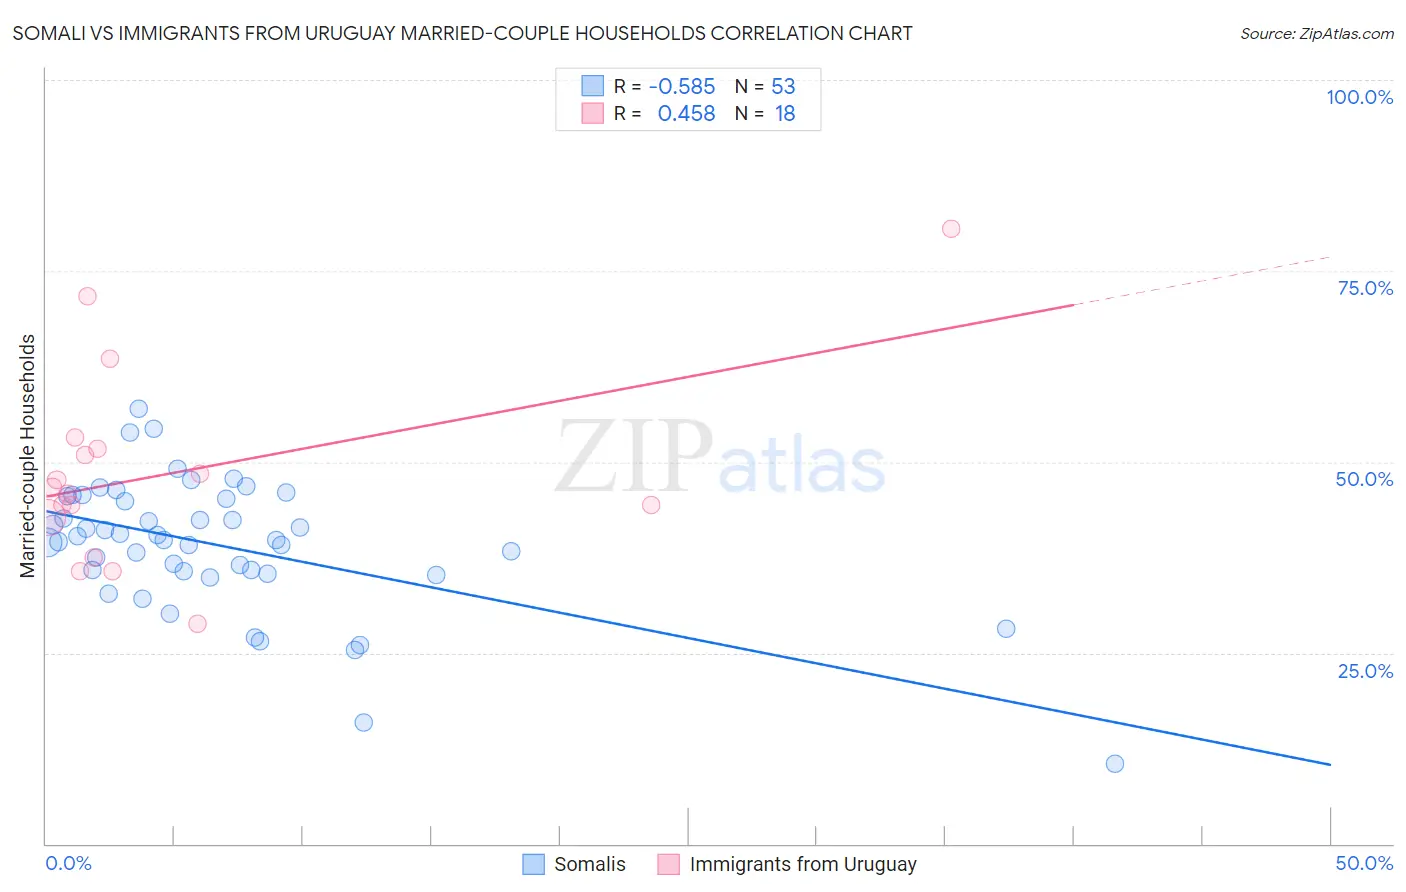
Somali vs Immigrants from Uruguay Married-couple Households Correlation Chart
The statistical analysis conducted on geographies consisting of 99,290,778 people shows a substantial negative correlation between the proportion of Somalis and percentage of married-couple family households in the United States with a correlation coefficient (R) of -0.585 and weighted average of 39.0%. Similarly, the statistical analysis conducted on geographies consisting of 133,245,142 people shows a moderate positive correlation between the proportion of Immigrants from Uruguay and percentage of married-couple family households in the United States with a correlation coefficient (R) of 0.458 and weighted average of 44.5%, a difference of 14.1%.
Married-couple Households Correlation Summary
| Measurement | Somali | Immigrants from Uruguay |
| Minimum | 10.5% | 28.8% |
| Maximum | 57.0% | 80.5% |
| Range | 46.6% | 51.7% |
| Mean | 39.1% | 48.5% |
| Median | 39.8% | 46.2% |
| Interquartile 25% (IQ1) | 35.5% | 42.8% |
| Interquartile 75% (IQ3) | 45.3% | 51.7% |
| Interquartile Range (IQR) | 9.8% | 8.9% |
| Standard Deviation (Sample) | 8.7% | 12.7% |
| Standard Deviation (Population) | 8.6% | 12.4% |
Similar Demographics by Married-couple Households
Demographics Similar to Somalis by Married-couple Households
In terms of married-couple households, the demographic groups most similar to Somalis are Immigrants from West Indies (39.0%, a difference of 0.030%), Immigrants from Congo (39.0%, a difference of 0.090%), Immigrants from Barbados (39.2%, a difference of 0.52%), Immigrants from St. Vincent and the Grenadines (38.7%, a difference of 0.81%), and Immigrants from Dominica (39.4%, a difference of 0.96%).
| Demographics | Rating | Rank | Married-couple Households |
| Pueblo | 0.0 /100 | #325 | Tragic 40.0% |
| U.S. Virgin Islanders | 0.0 /100 | #326 | Tragic 39.8% |
| Lumbee | 0.0 /100 | #327 | Tragic 39.6% |
| Barbadians | 0.0 /100 | #328 | Tragic 39.4% |
| Immigrants | Dominica | 0.0 /100 | #329 | Tragic 39.4% |
| Immigrants | Barbados | 0.0 /100 | #330 | Tragic 39.2% |
| Immigrants | Congo | 0.0 /100 | #331 | Tragic 39.0% |
| Somalis | 0.0 /100 | #332 | Tragic 39.0% |
| Immigrants | West Indies | 0.0 /100 | #333 | Tragic 39.0% |
| Immigrants | St. Vincent and the Grenadines | 0.0 /100 | #334 | Tragic 38.7% |
| Senegalese | 0.0 /100 | #335 | Tragic 38.6% |
| Blacks/African Americans | 0.0 /100 | #336 | Tragic 38.5% |
| Immigrants | Somalia | 0.0 /100 | #337 | Tragic 38.4% |
| Immigrants | Senegal | 0.0 /100 | #338 | Tragic 38.4% |
| British West Indians | 0.0 /100 | #339 | Tragic 38.3% |
Demographics Similar to Immigrants from Uruguay by Married-couple Households
In terms of married-couple households, the demographic groups most similar to Immigrants from Uruguay are Spanish American (44.5%, a difference of 0.020%), Comanche (44.5%, a difference of 0.050%), Yaqui (44.5%, a difference of 0.080%), Immigrants from Nicaragua (44.5%, a difference of 0.090%), and Ute (44.4%, a difference of 0.10%).
| Demographics | Rating | Rank | Married-couple Households |
| Houma | 1.5 /100 | #231 | Tragic 44.6% |
| Marshallese | 1.5 /100 | #232 | Tragic 44.6% |
| Immigrants | Uganda | 1.5 /100 | #233 | Tragic 44.6% |
| Immigrants | Panama | 1.3 /100 | #234 | Tragic 44.6% |
| Immigrants | Nicaragua | 1.2 /100 | #235 | Tragic 44.5% |
| Yaqui | 1.2 /100 | #236 | Tragic 44.5% |
| Comanche | 1.2 /100 | #237 | Tragic 44.5% |
| Immigrants | Uruguay | 1.1 /100 | #238 | Tragic 44.5% |
| Spanish Americans | 1.1 /100 | #239 | Tragic 44.5% |
| Ute | 1.0 /100 | #240 | Tragic 44.4% |
| Immigrants | Bosnia and Herzegovina | 1.0 /100 | #241 | Tragic 44.4% |
| Immigrants | Albania | 1.0 /100 | #242 | Tragic 44.4% |
| Immigrants | Saudi Arabia | 0.9 /100 | #243 | Tragic 44.4% |
| Immigrants | Armenia | 0.7 /100 | #244 | Tragic 44.3% |
| Immigrants | El Salvador | 0.7 /100 | #245 | Tragic 44.3% |