Immigrants from Indonesia vs Immigrants from Micronesia Married-couple Households
COMPARE
Immigrants from Indonesia
Immigrants from Micronesia
Married-couple Households
Married-couple Households Comparison
Immigrants from Indonesia
Immigrants from Micronesia
48.5%
MARRIED-COUPLE HOUSEHOLDS
99.2/ 100
METRIC RATING
58th/ 347
METRIC RANK
44.9%
MARRIED-COUPLE HOUSEHOLDS
2.6/ 100
METRIC RATING
224th/ 347
METRIC RANK
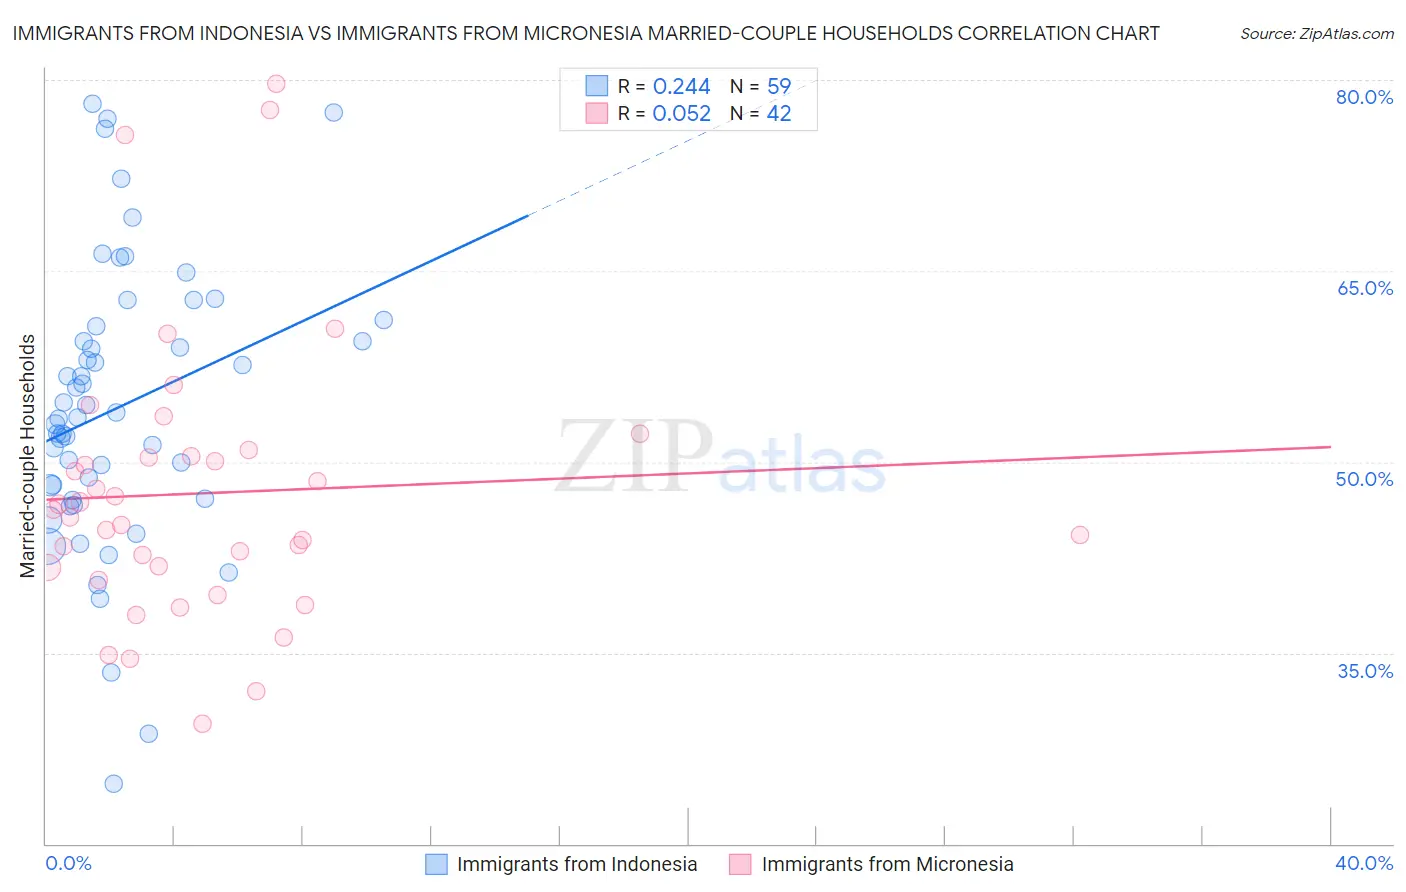
Immigrants from Indonesia vs Immigrants from Micronesia Married-couple Households Correlation Chart
The statistical analysis conducted on geographies consisting of 215,718,845 people shows a weak positive correlation between the proportion of Immigrants from Indonesia and percentage of married-couple family households in the United States with a correlation coefficient (R) of 0.244 and weighted average of 48.5%. Similarly, the statistical analysis conducted on geographies consisting of 61,600,267 people shows a slight positive correlation between the proportion of Immigrants from Micronesia and percentage of married-couple family households in the United States with a correlation coefficient (R) of 0.052 and weighted average of 44.9%, a difference of 8.2%.
Married-couple Households Correlation Summary
| Measurement | Immigrants from Indonesia | Immigrants from Micronesia |
| Minimum | 24.7% | 29.5% |
| Maximum | 78.1% | 79.7% |
| Range | 53.5% | 50.3% |
| Mean | 54.3% | 47.5% |
| Median | 53.5% | 45.9% |
| Interquartile 25% (IQ1) | 47.1% | 41.7% |
| Interquartile 75% (IQ3) | 60.7% | 50.4% |
| Interquartile Range (IQR) | 13.6% | 8.7% |
| Standard Deviation (Sample) | 11.1% | 10.9% |
| Standard Deviation (Population) | 11.0% | 10.7% |
Similar Demographics by Married-couple Households
Demographics Similar to Immigrants from Indonesia by Married-couple Households
In terms of married-couple households, the demographic groups most similar to Immigrants from Indonesia are Polish (48.5%, a difference of 0.0%), Czechoslovakian (48.5%, a difference of 0.0%), Croatian (48.5%, a difference of 0.080%), Austrian (48.6%, a difference of 0.090%), and Immigrants from Northern Europe (48.6%, a difference of 0.090%).
| Demographics | Rating | Rank | Married-couple Households |
| Eastern Europeans | 99.3 /100 | #51 | Exceptional 48.6% |
| Irish | 99.3 /100 | #52 | Exceptional 48.6% |
| Whites/Caucasians | 99.3 /100 | #53 | Exceptional 48.6% |
| Immigrants | Lithuania | 99.3 /100 | #54 | Exceptional 48.6% |
| Austrians | 99.3 /100 | #55 | Exceptional 48.6% |
| Immigrants | Northern Europe | 99.3 /100 | #56 | Exceptional 48.6% |
| Poles | 99.2 /100 | #57 | Exceptional 48.5% |
| Immigrants | Indonesia | 99.2 /100 | #58 | Exceptional 48.5% |
| Czechoslovakians | 99.2 /100 | #59 | Exceptional 48.5% |
| Croatians | 99.1 /100 | #60 | Exceptional 48.5% |
| Bulgarians | 99.1 /100 | #61 | Exceptional 48.5% |
| Luxembourgers | 99.1 /100 | #62 | Exceptional 48.5% |
| Basques | 99.0 /100 | #63 | Exceptional 48.4% |
| Northern Europeans | 99.0 /100 | #64 | Exceptional 48.4% |
| Immigrants | Canada | 99.0 /100 | #65 | Exceptional 48.4% |
Demographics Similar to Immigrants from Micronesia by Married-couple Households
In terms of married-couple households, the demographic groups most similar to Immigrants from Micronesia are Dutch West Indian (44.9%, a difference of 0.020%), Immigrants from Cambodia (44.9%, a difference of 0.030%), Alsatian (44.8%, a difference of 0.12%), Salvadoran (44.7%, a difference of 0.31%), and Kenyan (44.7%, a difference of 0.43%).
| Demographics | Rating | Rank | Married-couple Households |
| Panamanians | 5.5 /100 | #217 | Tragic 45.2% |
| Immigrants | Azores | 5.3 /100 | #218 | Tragic 45.2% |
| Nicaraguans | 5.3 /100 | #219 | Tragic 45.2% |
| Immigrants | Thailand | 5.1 /100 | #220 | Tragic 45.2% |
| Tlingit-Haida | 4.9 /100 | #221 | Tragic 45.1% |
| Immigrants | Laos | 4.6 /100 | #222 | Tragic 45.1% |
| Immigrants | Cambodia | 2.7 /100 | #223 | Tragic 44.9% |
| Immigrants | Micronesia | 2.6 /100 | #224 | Tragic 44.9% |
| Dutch West Indians | 2.6 /100 | #225 | Tragic 44.9% |
| Alsatians | 2.3 /100 | #226 | Tragic 44.8% |
| Salvadorans | 1.9 /100 | #227 | Tragic 44.7% |
| Kenyans | 1.7 /100 | #228 | Tragic 44.7% |
| Immigrants | Latin America | 1.6 /100 | #229 | Tragic 44.7% |
| Soviet Union | 1.6 /100 | #230 | Tragic 44.6% |
| Houma | 1.5 /100 | #231 | Tragic 44.6% |